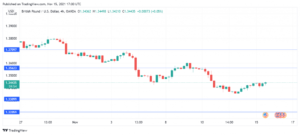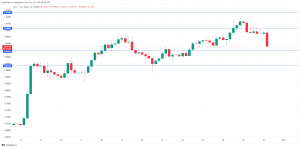
- Russell 2000 has staged a major bearish breakdown from its “Symmetrical Triangle” range support in place since June/September 2022 which also coincided with the current major swing lows areas of the Nasdaq 100 and S&P 500 formed last year.
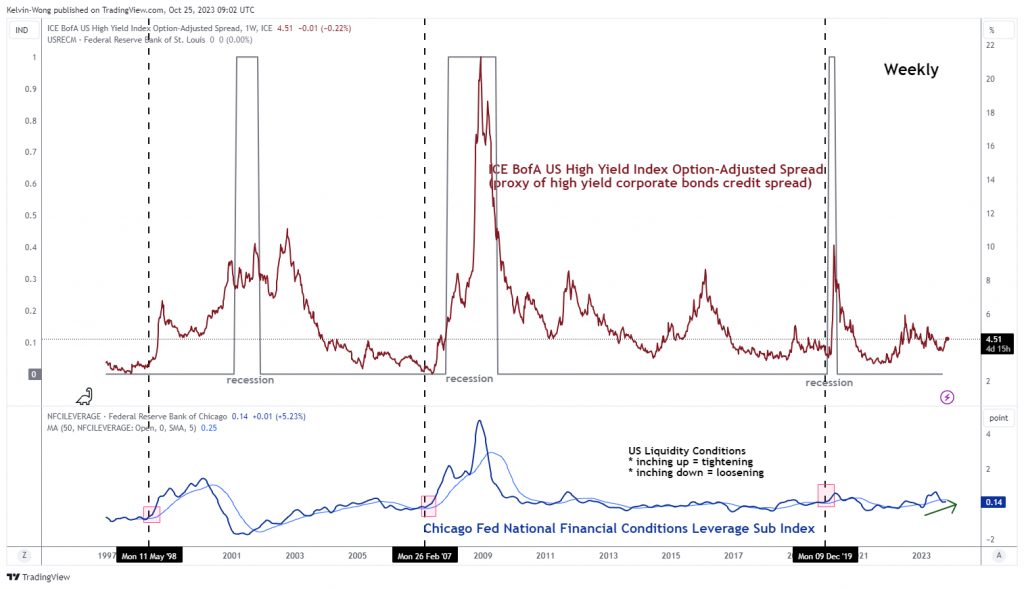
- A further potential spike up in the ICE BofA US High Yield Index option-adjusted spread may trigger further downside pressure in the Russell 2000.
- Observe la resistencia clave a corto plazo en 1,715.
Este es un análisis de seguimiento de nuestro informe anterior, “Russell 2000 Technical: The weakest among the major US stock indices” publicado el 14 de septiembre de 2023. Haga clic en esta página para un resumen.
La Índice US Russ 2000 (a proxy for the Russell 2000 futures) has indeed inched lower and staged a major bearish breakdown below a four-month “Symmetrical Triangle” range configuration in place since the June 2022 low of 1,1640 on the week of 9 October 2023.
Its 2023 year-to-date return as of the close of yesterday (24 October) US session stands at a loss of -4.64%, which clearly has underperformed the other US benchmark stock indices; Nasdaq 100 (+34.79%), S&P 500 (+10.63%), Dow Jones Industrial Average (-0.02%) over a similar period.
The small-cap Russell 2000 is considered a better proxy of the US economy as its constituents derive close to 80% of its revenue from the US and approximately 40% of the Russell 2000 Index is unprofitable. Hence, these “zombie companies “with lower credit ratings are likely dependent on a relatively high level of debt to maintain their business operations.
The recent significant surge in the longer-term US Treasury yields where the US 10-year Treasury yield has probed the psychological 5% level earlier this week with no clear signs of a bullish exhaustion condition yet to be seen.
Watch out for a potential upward spike in US high-yield corporate bonds’ credit spread
The lagging high-yield corporation bonds credit spread as indicated by the ICE BofA US High Yield Index option-adjusted spread has finally ticked higher in the past week to a five-month high of 4.51 as of Monday, 23 October due to a persistent upward movement of the US 10-year Treasury yield Also, the liquidity condition in the US has started to get tighter as seen by the recent movement of the Chicago Fed National Financial Conditions Leverage Sub Index that has shaped a “higher low” in (see figure 1).
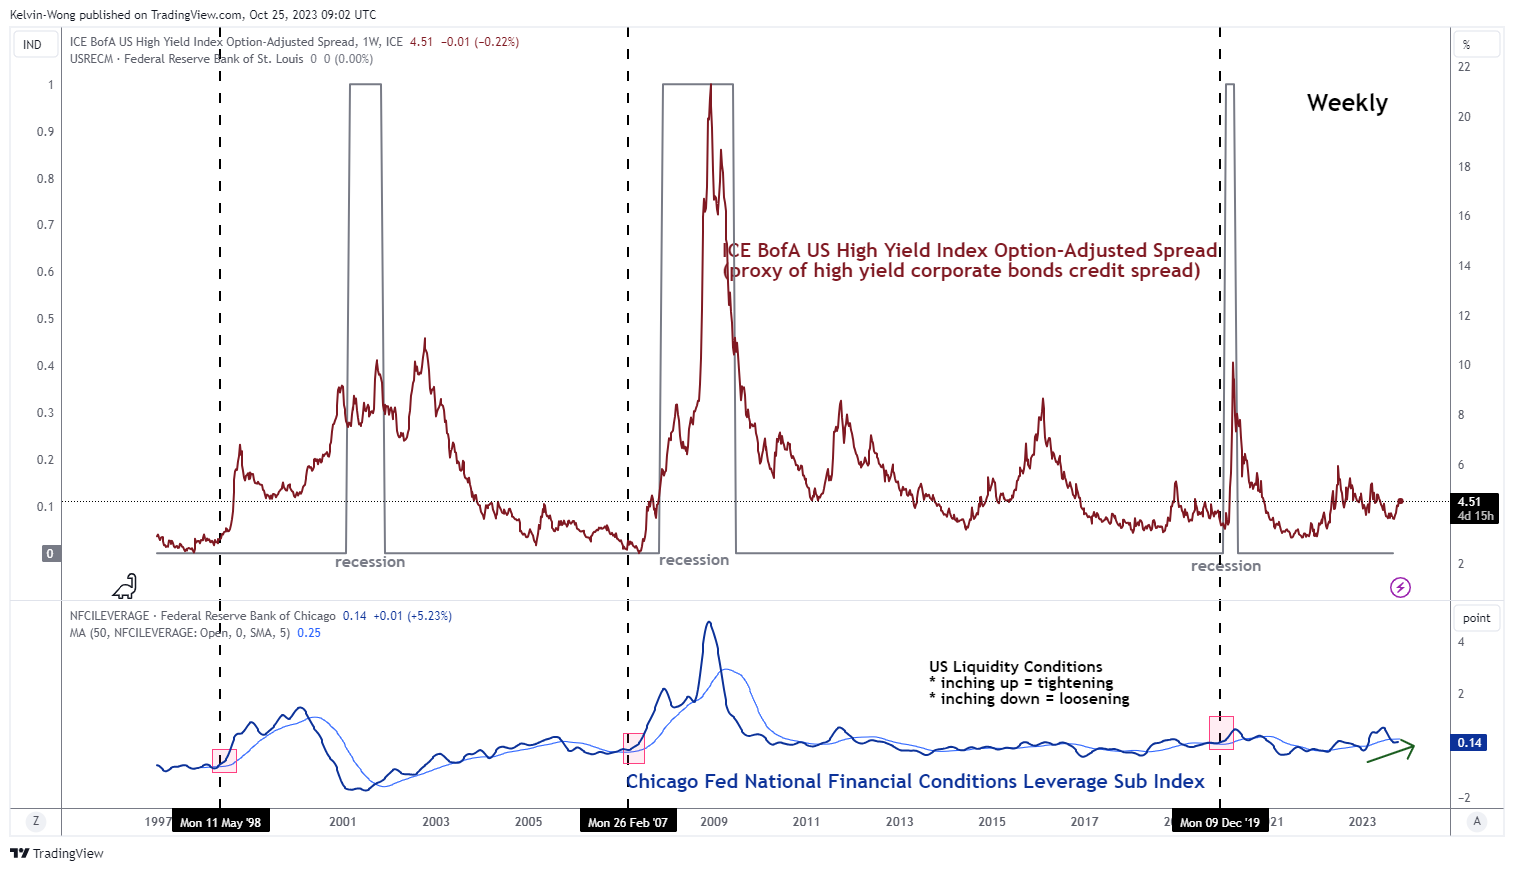
Fig 1: ICE BofA US High Yield Index Option-Adjusted Spread with US liquidity conditions as of 23 Oct 2023 (Source: TradingView, click to enlarge chart)
These key macro-observations suggest a higher cost of funding environment for lower credit rating US corporations that in turn lead to lower earnings growth and guidance that is likely to put further downside pressure on the Russell 2000 in Q4 which in turn increases the odds of a recession in the US in early 2024.
Oscilando dentro de un canal descendente de mediano plazo
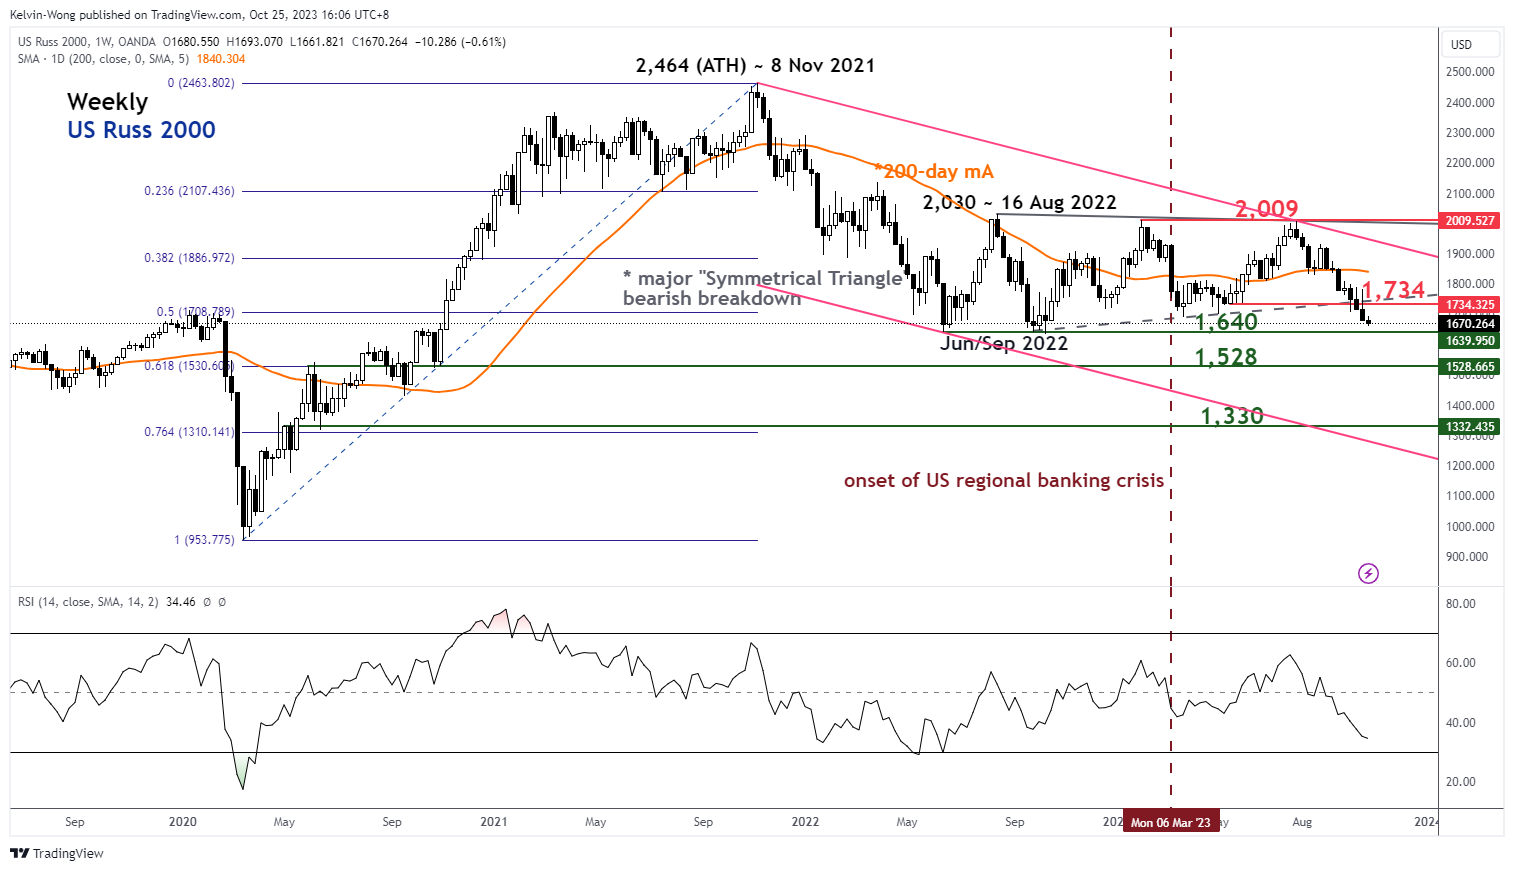
Fig 2: US Russ 2000 major trend as of 25 Oct 2023 (Source: TradingView, click to enlarge chart)
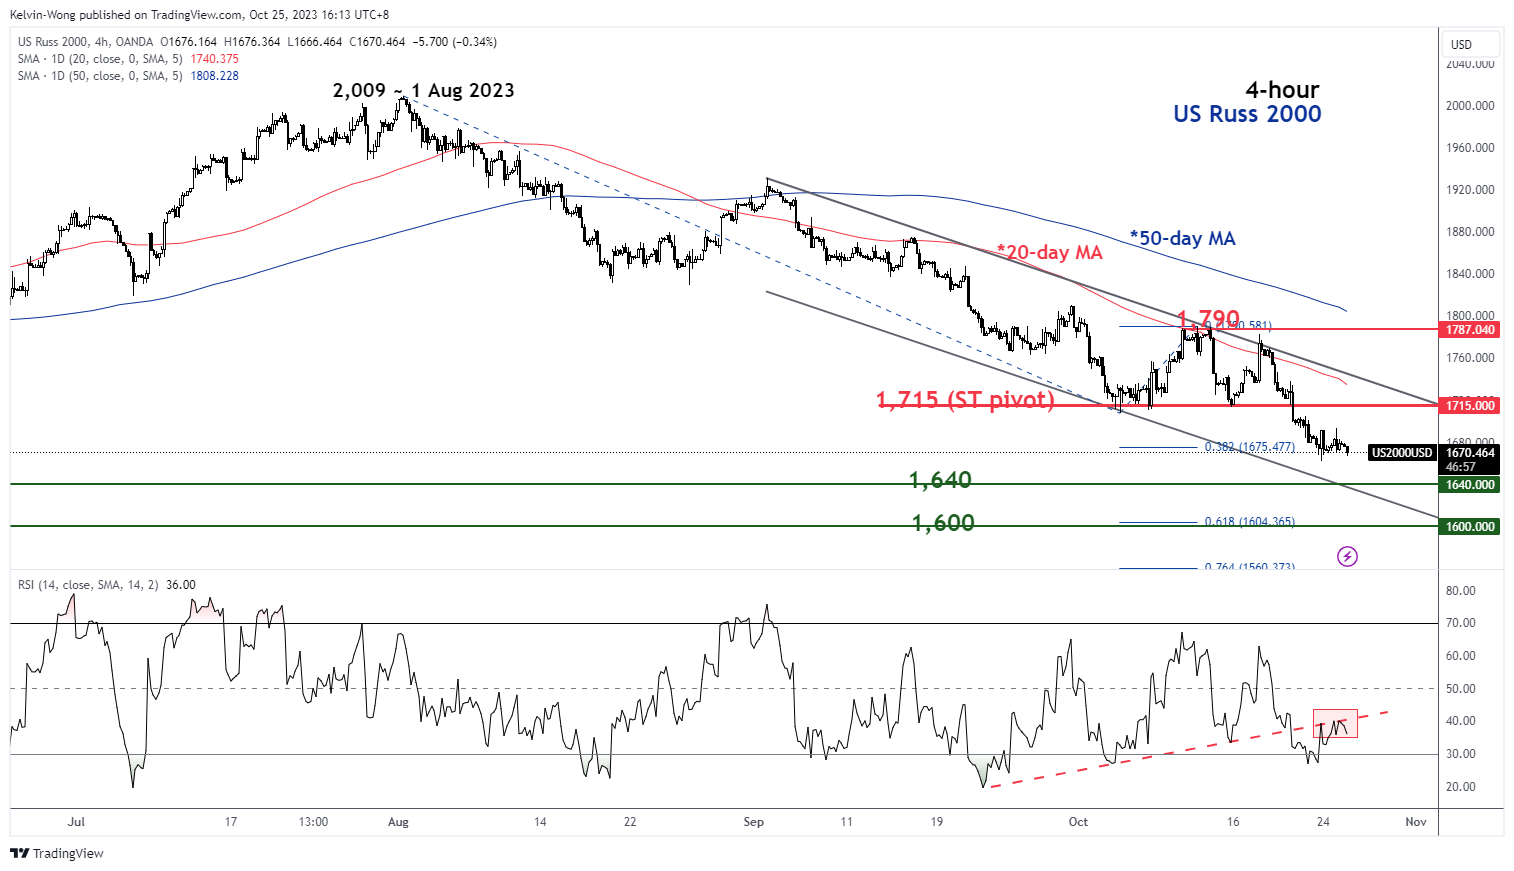
Fig 3: US Russ 2000 short and medium trends as of 25 Oct 2023 (Source: TradingView, click to enlarge chart)
Since its bearish breakdown from its major “Symmetrical Triangle” in early October 2023, the price actions of the US Russ 2000 Index are still evolving within a medium-term downtrend phase.
In addition, the bearish momentum remains intact as depicted by the 4-hour RSI momentum indicator that has just staged a bearish reaction off its parallel resistance at the 40 level and has not reached its oversold region (below 30).
Watch the 1,715 key short-term pivotal resistance (also the downward-slopping 20-day moving average) for a potential extension of the current impulsive down move sequence towards the next intermediate supports at 1,640 and 1,600.
However, a clearance above 1,715 negates the bearish tone to see the next intermediate resistance coming in at 1,790 (also, the 50-day moving average).
El contenido es solo para fines de información general. No es un consejo de inversión ni una solución para comprar o vender valores. Las opiniones son de los autores; no necesariamente la de OANDA Business Information & Services, Inc. o cualquiera de sus afiliadas, subsidiarias, funcionarios o directores. Si desea reproducir o redistribuir cualquiera de los contenidos que se encuentran en MarketPulse, un galardonado servicio de sitio de noticias y análisis de divisas, materias primas e índices globales producido por OANDA Business Information & Services, Inc., acceda a la fuente RSS o póngase en contacto con nosotros en info@marketpulse.com. Visita https://www.marketpulse.com/ para obtener más información sobre el ritmo de los mercados globales. © 2023 OANDA Business Information & Services Inc.
Últimos mensajes de Kelvin Wong (ver todo)
- Distribución de relaciones públicas y contenido potenciado por SEO. Consiga amplificado hoy.
- PlatoData.Network Vertical Generativo Ai. Empodérate. Accede Aquí.
- PlatoAiStream. Inteligencia Web3. Conocimiento amplificado. Accede Aquí.
- PlatoESG. Carbón, tecnología limpia, Energía, Ambiente, Solar, Gestión de residuos. Accede Aquí.
- PlatoSalud. Inteligencia en Biotecnología y Ensayos Clínicos. Accede Aquí.
- Fuente: https://www.marketpulse.com/indices/russell-2000-technical-the-weakest-may-get-weaker-again/kwong
- :posee
- :es
- :no
- :dónde
- ][pag
- $ UP
- 1
- 100
- 14
- 15 años
- 15%
- 2000
- 2022
- 2023
- 2024
- 23
- 24
- 25
- 30
- 40
- 500
- 51
- 700
- 9
- a
- Nuestra Empresa
- arriba
- de la máquina
- acciones
- adición
- consejos
- Afiliados
- de nuevo
- también
- entre
- an
- análisis
- análisis
- y
- cualquier
- aproximadamente
- somos
- áreas
- en torno a
- AS
- At
- autor
- Autorzy
- avatar
- promedio
- de premio
- BE
- bajista
- Ímpetu bajista
- golpear
- a continuación
- mejores
- Bofá
- Bonos
- Box
- Breakdown
- Alcista
- operaciones de negocios
- botones
- comprar
- by
- Tabla
- Chicago
- Fed de Chicago
- limpiar
- signos claros
- espacio
- con claridad.
- clic
- Cerrar
- coincidió
- COM
- combinación
- viniendo
- Materias primas
- Empresas
- condición
- condiciones
- llevado a cabo
- Configuración
- Conectándote
- considerado
- contacte
- contenido
- Sector empresarial
- CORPORACIÓN
- Corporaciones
- Cost
- cursos
- crédito
- calificación crediticia
- Current
- Deuda
- dependiente
- directiva
- dow
- Dow Jones
- Dow Jones de Industriales
- DE INSCRIPCIÓN
- Abajo
- dos
- Más temprano
- Temprano en la
- Ganancias
- economia
- Elliott
- ampliar
- Entorno
- Éter (ETH)
- evolución
- Intercambio
- experience
- experto
- extensión
- Fed
- Figura
- Finalmente
- financiero
- Encuentre
- de tus señales
- extranjero
- divisas
- Calendario de divisas
- formado
- encontrado
- Desde
- fondo
- fundamental
- universidad
- promover
- Futuros
- General
- obtener
- Buscar
- los mercados globales
- Crecimiento
- guía
- por lo tanto
- Alta
- Alto Rendimiento
- más alto
- HTTPS
- HIELO
- if
- impulsivo
- in
- Inc.
- Los aumentos
- índice
- indicado
- Indicador
- Indices
- industrial
- información
- Intermedio
- inversión extranjera
- IT
- SUS
- Jones
- junio
- solo
- Kelvin
- Clave
- rezagado
- Apellido
- El año pasado
- Lead
- Nivel
- Apalancamiento
- como
- que otros
- Liquidez
- de
- Baja
- inferior
- Bajas
- Macro
- mantener
- gran
- Mercado
- perspectiva del mercado
- encuestas de mercado
- MarketPulse
- Industrias
- max-ancho
- Puede..
- mediano
- Momentum
- Lunes
- más,
- movimiento
- movimiento
- emocionante
- media móvil
- Nasdaq
- Nasdaq 100
- Nacional
- necesariamente
- noticias
- Next
- no
- numeroso
- Oct
- octubre
- Odds
- of
- off
- oficiales
- on
- , solamente
- Operaciones
- Opiniones
- or
- Otro
- nuestros
- salir
- Outlook
- Más de
- Paralelo
- apasionado
- pasado
- período
- perspectivas
- fase
- esencial
- Colocar
- Platón
- Inteligencia de datos de Platón
- PlatónDatos
- Por favor
- posicionamiento
- Artículos
- posible
- presión
- precio
- Anterior
- producido
- proporcionando
- apoderado
- psicológico
- publicado
- fines
- poner
- distancia
- .
- Calificaciones
- alcanzado
- reacción
- resumen
- reciente
- recesión
- región
- relativamente
- permanece
- reporte
- la investigación
- Resistencia
- el comercio minorista
- volvemos
- ingresos
- Inversión
- rsi
- rss
- S & P
- S & P 500
- Valores
- ver
- visto
- venta
- mayor
- Septiembre
- Secuencia
- de coches
- Servicios
- Sesión
- en forma de
- compartir
- En Corto
- a corto plazo
- importante
- Letreros y Pancartas
- similares
- desde
- Singapur
- página web
- a medida
- Fuente
- especializada
- espiga
- propagación
- es la
- fundó
- Sin embargo
- en stock
- Los mercados de valores
- Estratega
- filiales
- sugieren
- SOPORTE
- soportes
- oleada
- Swing
- Técnico
- Análisis técnico
- diez
- esa
- La
- su
- Estas
- así
- esta semana
- miles
- más apretado
- a
- TONO
- hacia
- Los comerciantes
- Plataforma de
- TradingView
- Formación
- tesorería
- Rendimientos de tesorería
- Tendencia
- Tendencias
- detonante
- GIRO
- único
- hacia arriba
- us
- Economía estadounidense
- Tesoro de los Estados Unidos
- Rendimientos del Tesoro de EE. UU.
- usando
- v1
- Visite
- Trenzado
- semana
- WELL
- que
- ganar
- dentro de
- Wong
- se
- año
- años
- Ayer
- aún
- Rendimiento
- los rendimientos
- Usted
- zephyrnet