
The US auto industry is truly on the rebound. In the 3rd quarter, sales increasing 1% compared to the 3rd quarter of 2021, the first positive trend in a while. But was it just a lucky little blip? Seemingly not, as US auto industry sales in the 4th quarter of 2022 were 10% higher than US auto industry sales in the 4th quarter of 2021.
So, the US auto industry is on the rise, but what about the details? Which brands are up, and which are down? Here’s a thorough Q4 vs. Q4 comparison going back through 2019. While you might find year-over-year comparisons of the US auto industry or even auto brands elsewhere, I don’t think you’ll find this level of comparison going back to pre-Covid times anywhere else on the internet. So, if you like this kind of thing, grab some popcorn, get comfy, and jump in below.
To start off, let’s just look at a chart of sales by auto brand.

There are three clear leaders — Toyota, Ford, and Chevrolet. Honda and Hyundai seem to have a good grasp on #4 and #5. The story in terms of clean technology is that Tesla is already in the top 10, in 9th place. That’s up from #11 in the 3er trimestre de 2022. Also, there’s an opportunity to climb up to 8th, 7th, 6th, or perhaps even 5th with a bit more of a sales bump. Can Tesla get there by the end of 2023? Does it need the Cybertruck or another new model in order to break into the top 5?
Heck, dreaming big, Tesla could even aim for #4. It’s stunning, but it’s within reach — even with just a handful of models.


Looking at the overall market trend, you can see that auto sales were up in the 4th quarter compared to the 4th quarter of 2021, but they were down significantly compared to Q4 2020 or 2019. They were down 16% compared to three years prior.
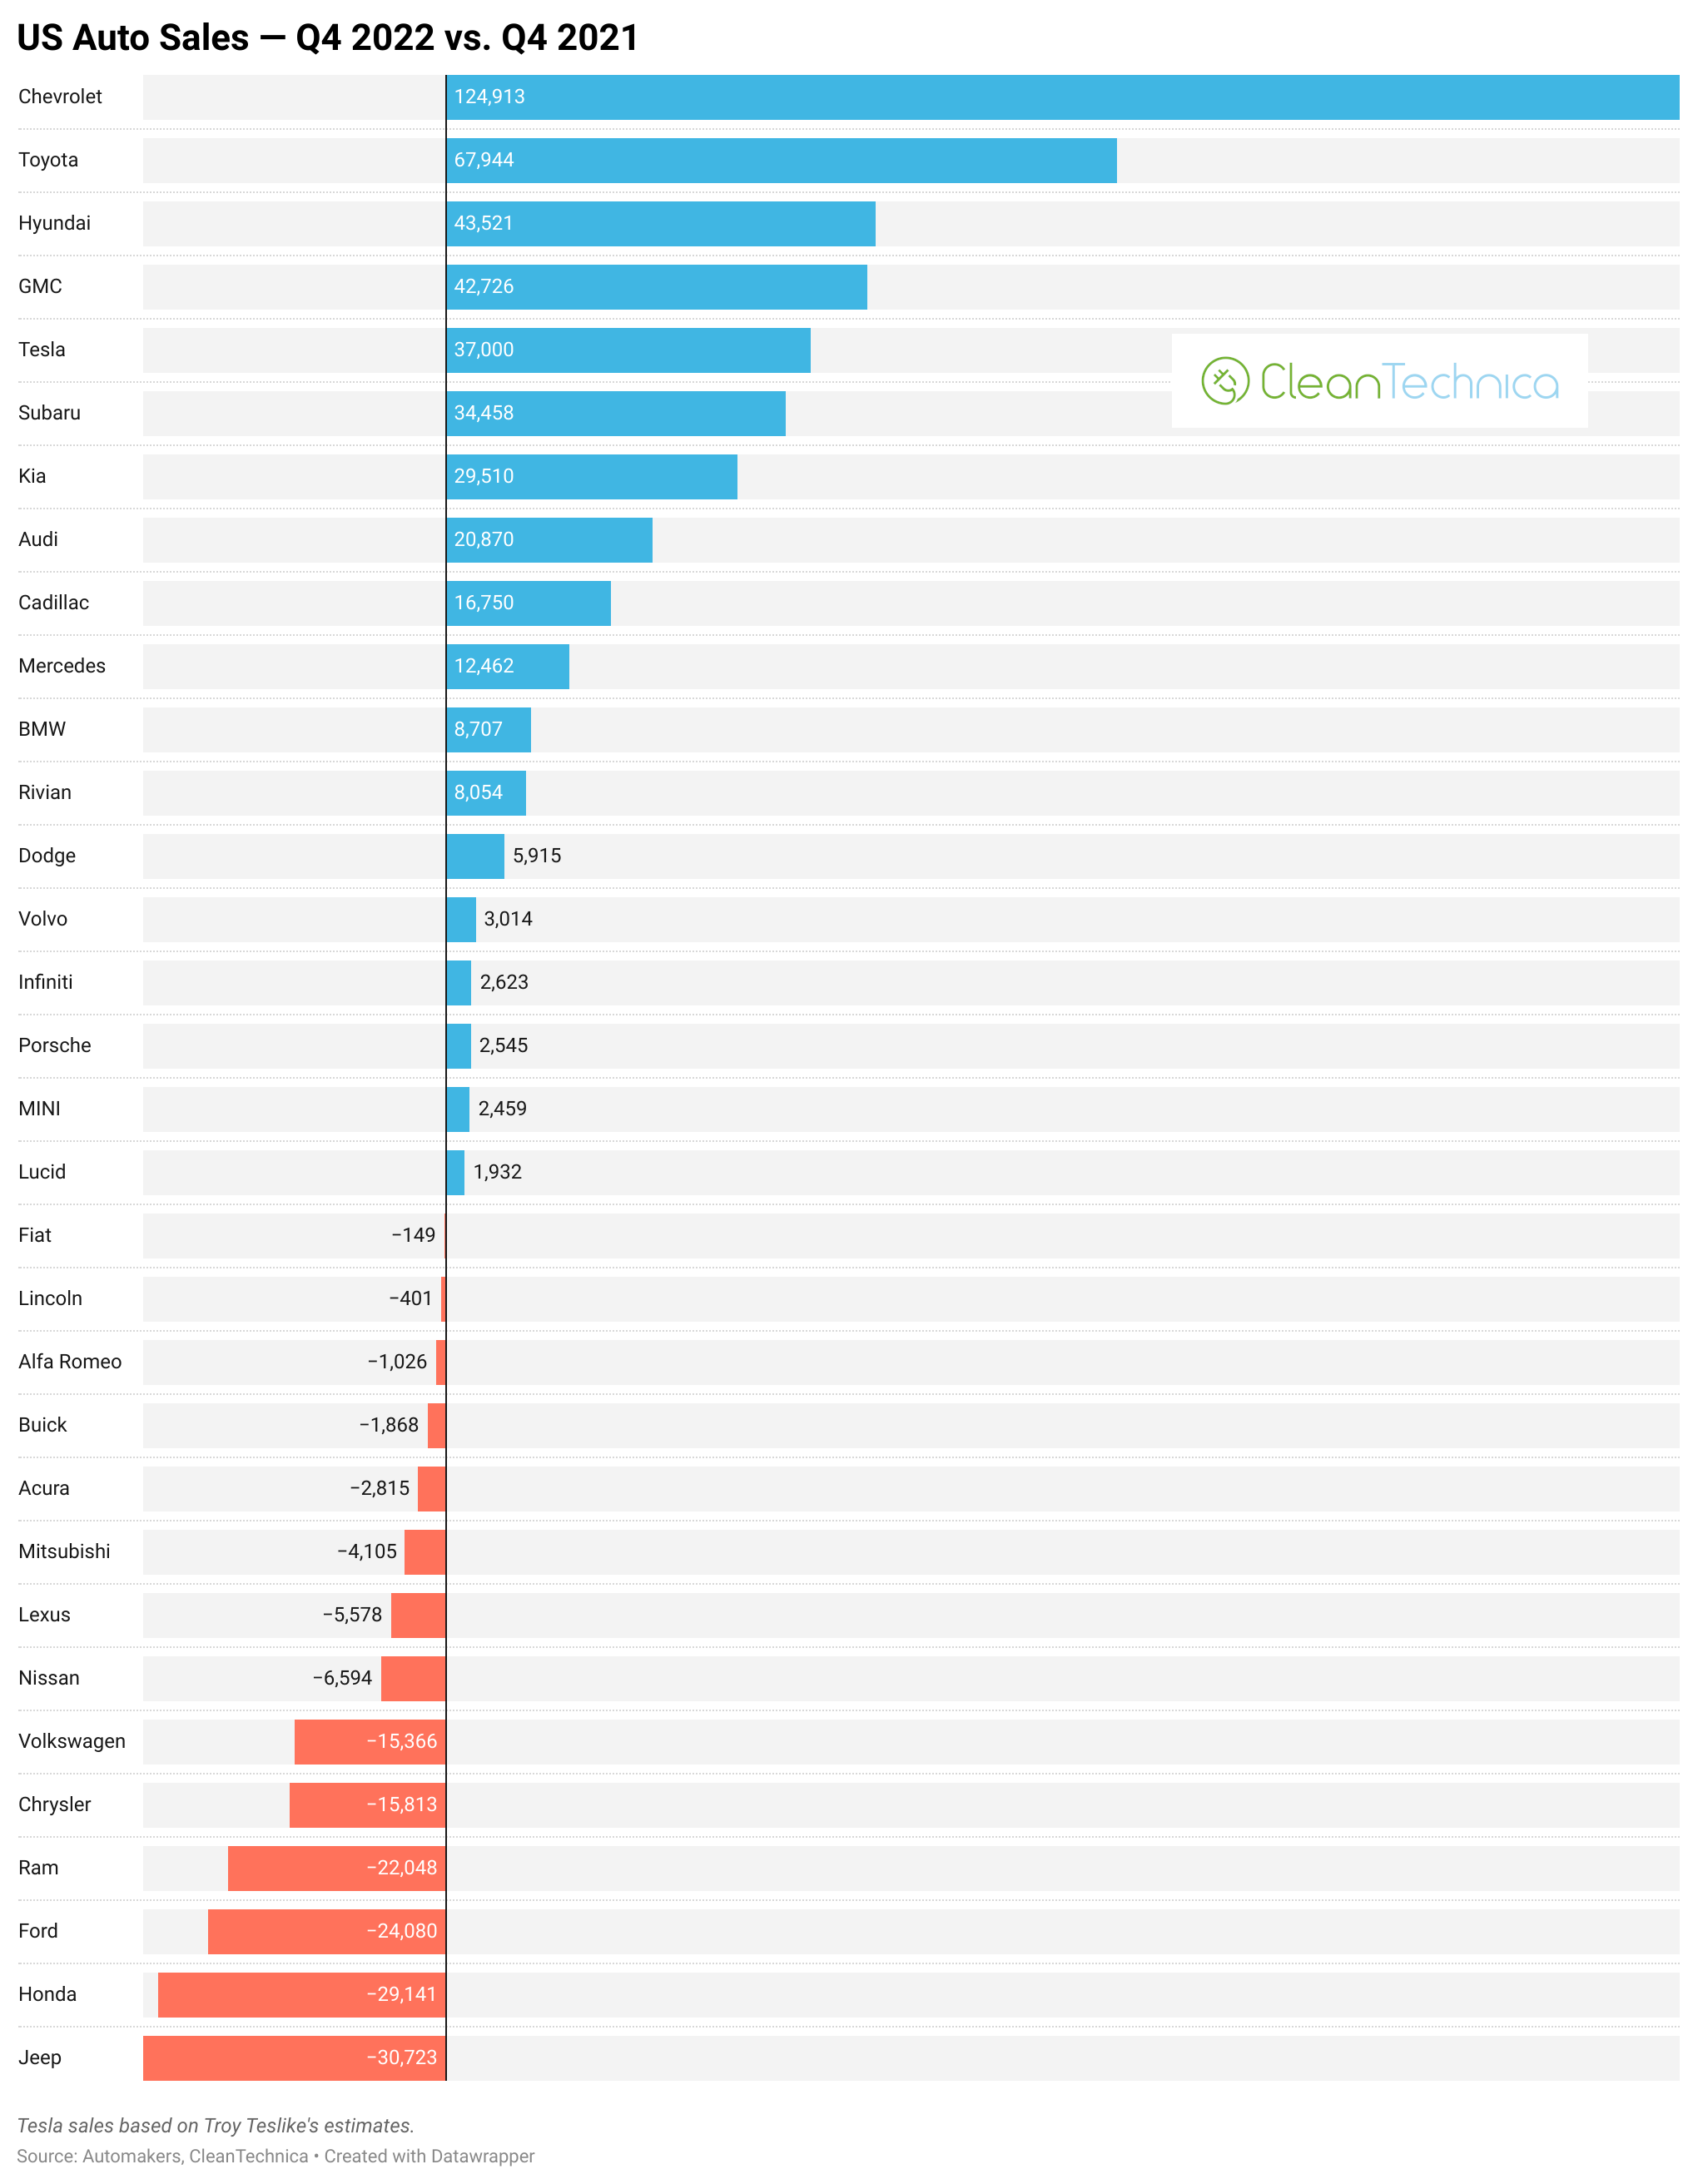

In Q4 2022 vs. Q4 2021, about half of auto brands saw their sales increase while about half saw their sales decrease. Clear winners in terms of volume growth were Chevrolet and Toyota. Key winners in terms of percentage growth were Cadillac and Audi. Tesla was 5th in terms of volume growth as well as percentage growth.
In terms of brands that lost some spark, Jeep and Honda topped the list in terms of unit sales, while Fiat (-56%) and Chrysler (-39%) were worst in terms of a percentage drop.
Recall that, overall, the industry was up 10% in Q4 2022 versus Q4 2021.


Comparing Q4 2022 to Q4 2020, only Tesla had strong volume growth, and it also led by far in terms of percentage growth. Chevrolet, Honda, and Toyota lost the most in volume terms, while Fiat (-84%) and Alfa Romeo (-50%) did in percentage terms.
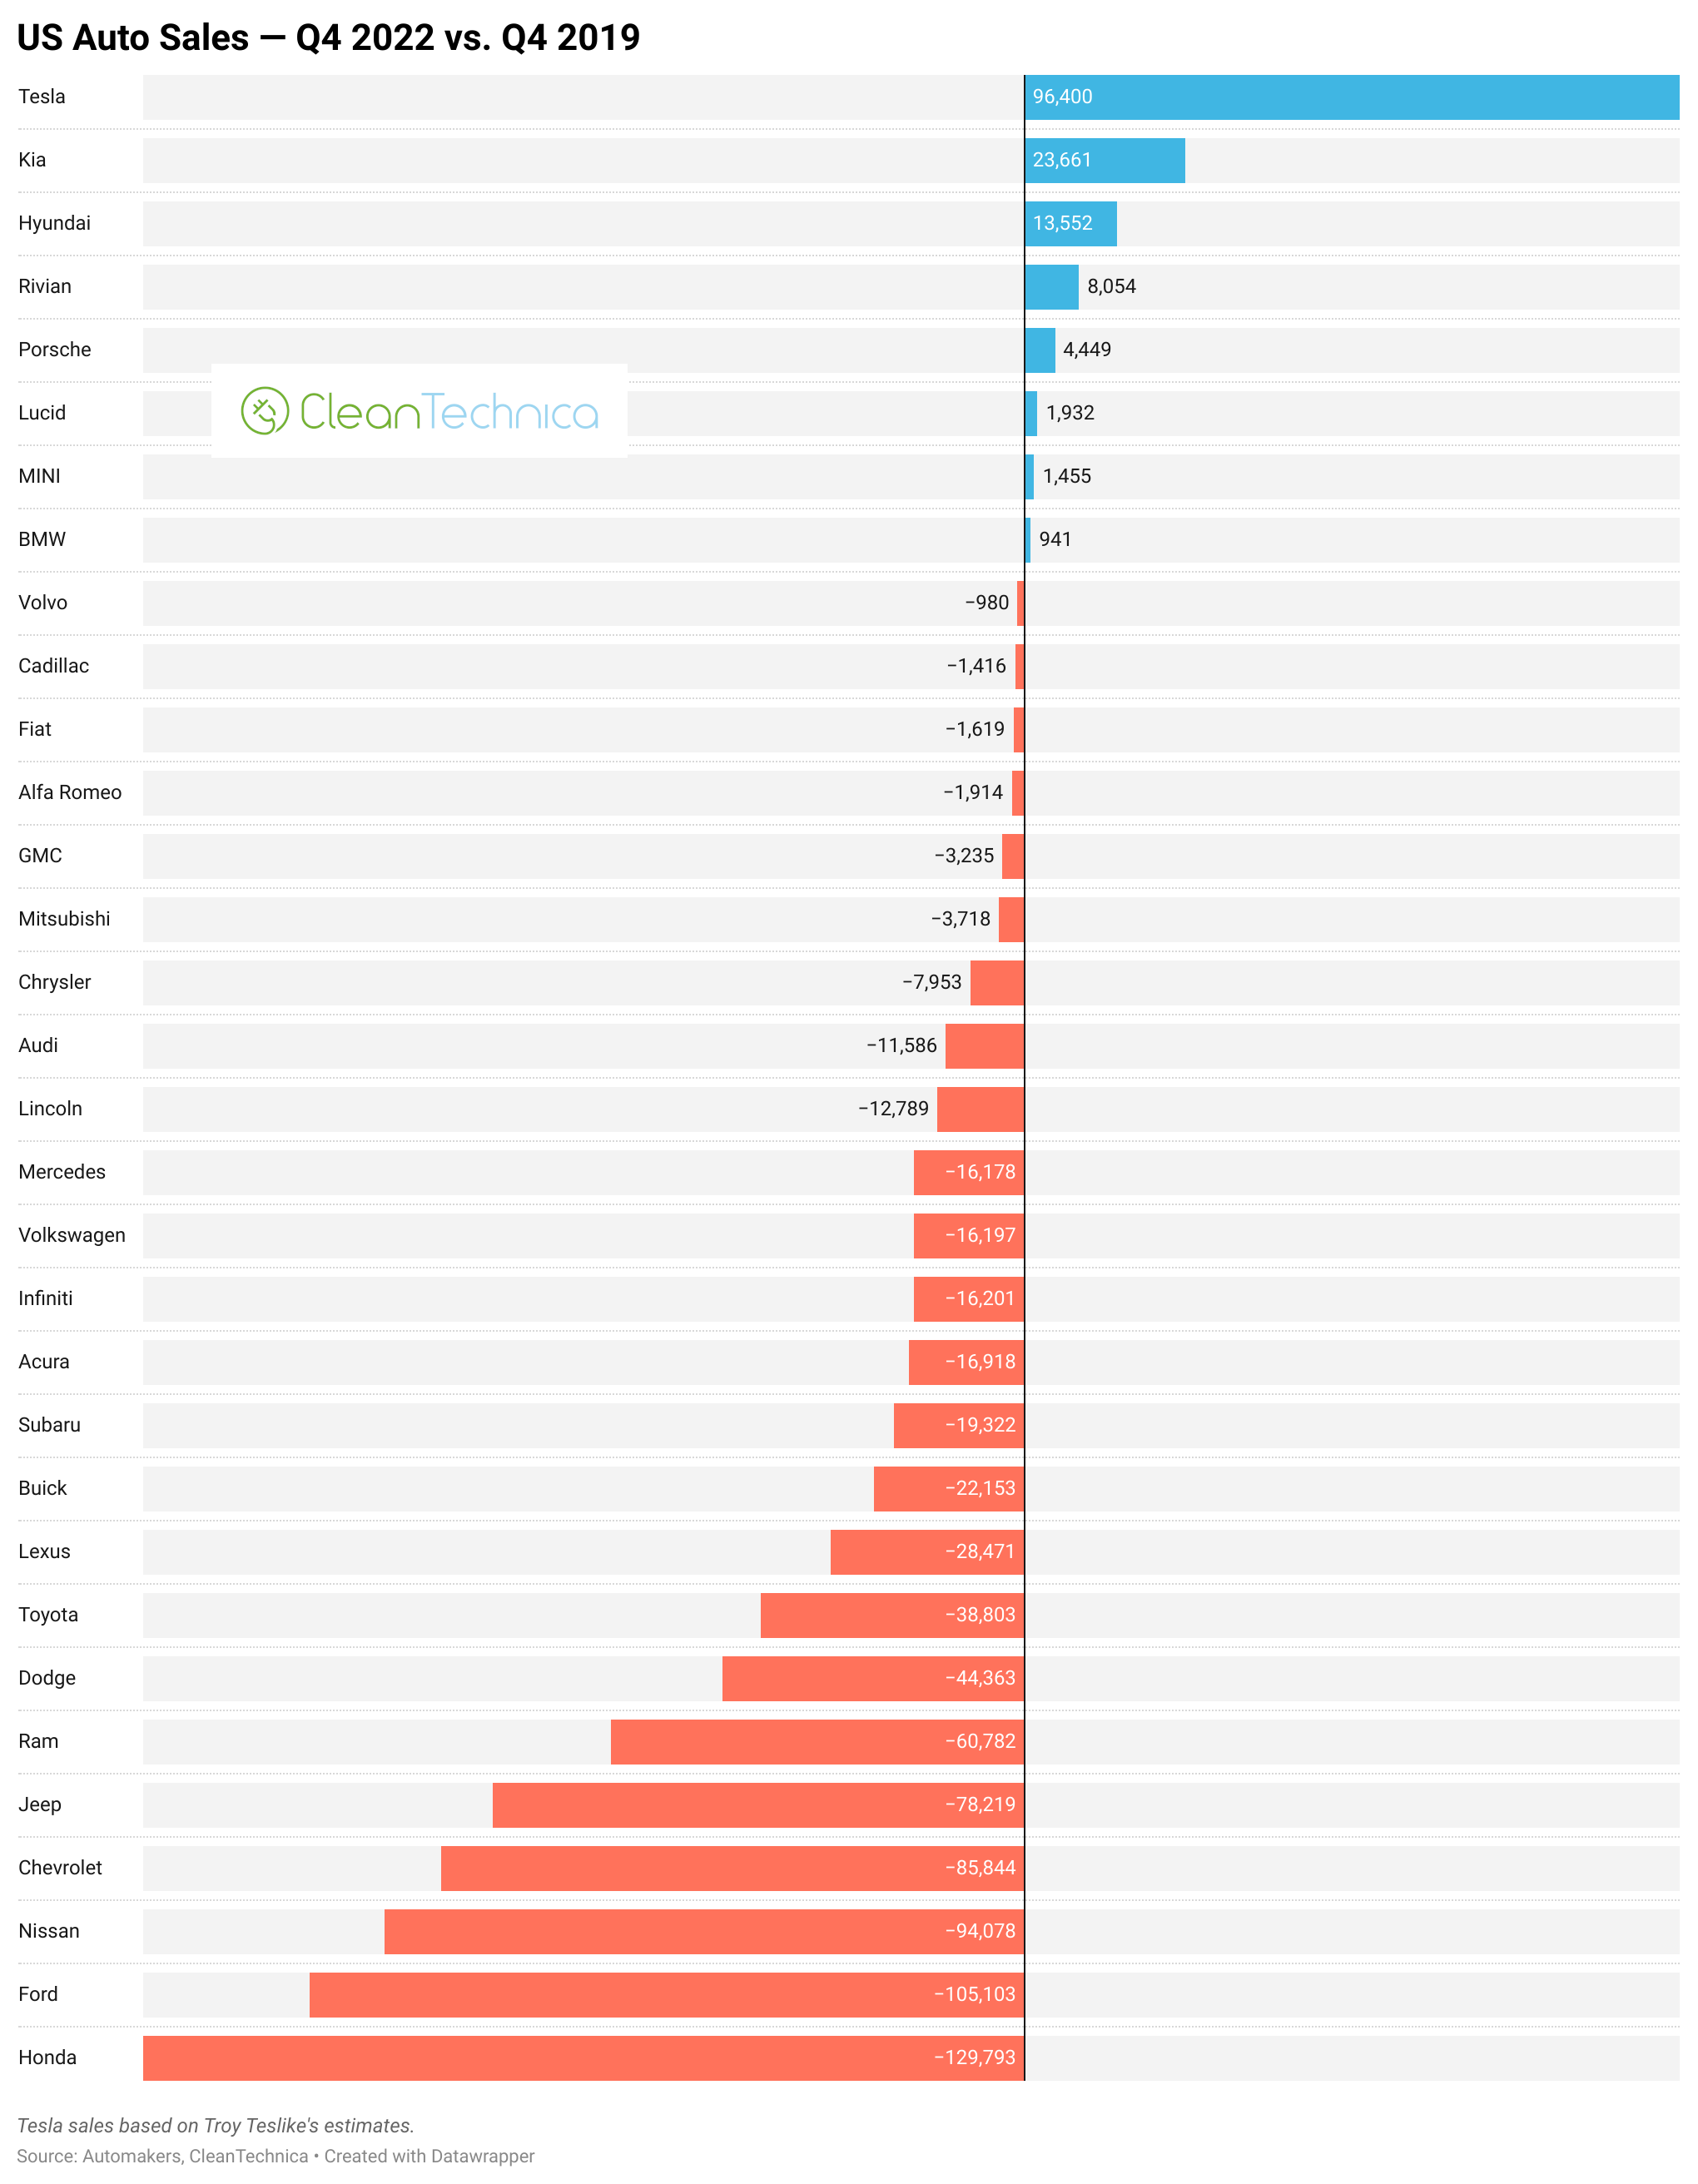

Compared to Q4 2019, few companies have seen improvement in the past 3 years. Most have seen significant sales drops. Tesla, however, has seen massive growth, up 96,400 or 180% in Q4 2022 compared to Q4 2019. Porsche saw 27% growth, up by 4,449 units. Kia, Hyundai, and MINI saw modest growth, and BMW saw tiny growth. All other legacy automakers saw their sales decline. Honda, Ford, Nissan, Chevrolet, and Jeep saw the biggest volume declines, while Fiat (-93%), Infiniti (-54%), Dodge (-49%), and Buick (-45%) saw the biggest percentage declines.
To wrap up, let’s look at a a lo grande chart. Below is a chart showing the Q4 US sales for each auto brand from Q4 2019 through Q4 2022. Aside from a yearly comparison (muy pronto), this is the best view we can get about the trajectory of each auto brand in the United States.

Toyota, the top selling in the country, saw a bounce in Q4 2022 after a big decline from Q4 2020 or even Q4 2019. Is it on the upswing with the economy rebounding and the automotive chip crisis improving? Or is this a “dead cat bounce” deception?
Ford is in a bit of a worse state. Despite being #2 in the US auto market, it has seen a consistent decline 4th quarter after 4th quarter.
Chevrolet has followed more or less the same trend as Toyota, implying that there’s something going on in the industry, and especially for brands with more low-cost, high-volume models.
Honda y Nissan, however, followed the same straight-decline trend as Ford. So, pick the trend that you think is stronger for an industry takeaway.
Hyundai, Kiay Subaru have been approximately stable (with some ups and downs through the 4 years of course).
Entonces llegamos a Tesla, which has risen to 9th in the US auto market, up from 18th in Q4 2019.
The industry is changing. That is certain. Where will the US auto industry be in the 4th quarter of 2023?
For extra fun, below is an interactive version of the last static chart used above. Note, however, that it may not show well on a mobile phone. Be sure to check it out on a computer for best viewing and interaction.
Historia relacionada: US Auto Sales Down 21% Vs. Q3 2019 — Tesla Up 169%
No me gustan los muros de pago. No te gustan los muros de pago. ¿A quién le gustan los muros de pago? Aquí en CleanTechnica, implementamos un muro de pago limitado por un tiempo, pero siempre se sintió mal, y siempre fue difícil decidir qué deberíamos poner detrás de él. En teoría, tu contenido más exclusivo y mejor va detrás de un muro de pago. ¡Pero entonces menos gente lo lee! Simplemente no nos gustan los muros de pago, por lo que hemos decidido deshacernos del nuestro. Desafortunadamente, el negocio de los medios sigue siendo un negocio duro y despiadado con márgenes pequeños. Es un desafío olímpico interminable mantenerse fuera del agua o incluso tal vez... jadear - crecer. Entonces …

- Distribución de relaciones públicas y contenido potenciado por SEO. Consiga amplificado hoy.
- Platoblockchain. Inteligencia del Metaverso Web3. Conocimiento amplificado. Accede Aquí.
- Fuente: https://cleantechnica.com/2023/02/26/us-auto-industry-up-10-in-4th-quarter-but-down-16-compared-to-q4-2019/
- 1
- 10
- 2019
- 2020
- 2021
- 2022
- 2023
- a
- Nuestra Empresa
- arriba
- Después
- Todos
- ya haya utilizado
- hacerlo
- y
- Otra
- dondequiera
- aproximadamente
- audi
- auto
- fabricantes de automóviles
- automotor
- Atrás
- detrás de
- "Ser"
- a continuación
- MEJOR
- Big
- Mayor
- Poco
- BMW
- Rebotar
- marca
- marcas
- Descanso
- Cadillac
- Puede conseguir
- CAT
- a ciertos
- Reto
- cambio
- Tabla
- comprobar
- Chevrolet
- chip
- Chrysler
- limpiar
- escalar
- Empresas
- en comparación con
- comparación
- computadora
- consistente
- contenido
- podría
- país
- curso
- humanitaria
- cybertruck
- decidido
- Rechazar
- Las disminuciones
- disminuir
- A pesar de las
- detalles
- HIZO
- Esquivar
- No
- DE INSCRIPCIÓN
- Soltar
- Gotas
- cada una
- economia
- en otra parte
- especialmente
- Incluso
- Exclusiva
- extra
- pocos
- fíat
- Encuentre
- Nombre
- seguido
- Ford
- Desde
- diversión
- obtener
- Va
- va
- candidato
- agarrar
- agarrar
- Crecer
- Crecimiento
- A Mitad
- puñado
- esta página
- más alto
- Sin embargo
- HTTPS
- Hyundai
- implementado
- es la mejora continua
- la mejora de
- in
- aumente
- creciente
- energético
- interacción
- interactivo
- Internet
- IT
- jeep
- saltar
- Clave
- Kia
- Tipo
- Apellido
- los líderes
- LED
- Legado
- Nivel
- Limitada
- Lista
- pequeño
- Mira
- márgenes
- Mercado
- masivo
- max-ancho
- Medios
- podría
- Móvil
- teléfono móvil
- modelo
- modelos
- más,
- MEJOR DE TU
- ¿ Necesita ayuda
- Nuevo
- Nissan
- Olímpico
- Oportunidad
- solicite
- Otro
- total
- pasado
- Personas
- porcentaje
- quizás
- teléfono
- recoger
- Colocar
- Platón
- Inteligencia de datos de Platón
- PlatónDatos
- Porsche
- positivo
- Anterior
- poner
- Q3
- Trimestre
- en comunicarse
- Leer
- Rebote
- Subir
- Resucitado
- ventas
- mismo
- vender
- tienes
- Mostrar
- importante
- significativamente
- So
- algo
- algo
- Spark
- estable
- comienzo
- Estado
- Zonas
- quedarse
- Sin embargo
- Historia
- fuerte
- más fuerte
- Tecnología
- términos
- Tesla
- La
- su
- Ahí.
- cosa
- Tres
- A través de esta formación, el personal docente y administrativo de escuelas y universidades estará preparado para manejar los recursos disponibles que derivan de la diversidad cultural de sus estudiantes. Además, un mejor y mayor entendimiento sobre estas diferencias y similitudes culturales permitirá alcanzar los objetivos de inclusión previstos.
- veces
- a
- parte superior
- Top 10
- top 5
- rematado
- toyota
- trayectoria
- Tendencia
- unidad
- United
- Estados Unidos
- unidades que
- UPS
- us
- Ve
- versión
- Versus
- Ver
- volumen
- Agua
- ¿
- que
- mientras
- QUIENES
- seguirá
- ganadores
- dentro de
- Peor
- envolver
- Mal
- años
- tú
- Youtube
- zephyrnet