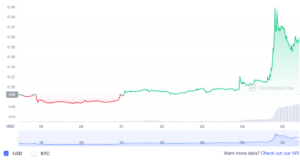
- BTC price has risen nearly 65% off its low in July
- BTC Price has finally cleared the 200MA
- RSI is printing a bearish divergence
Are BTC Bulls Already Exhausted?
Bitcoin price has finally broken out of its near 2 month range below $40,000. After nearly 3 months of boring downtrend, the bulls have awoken from their slumber & pushed BTC to nearly $50,000. The overall market has followed BTC’s lead as some alt coins have surged nearly 300% from their lows. After an $18,000 pump in 3 weeks, traders are wondering when a pullback will occur. It seems as if price has been losing steam the last few days which may indicate a short term pullback is near. This will allow BTC to continue rising in a healthy manner.
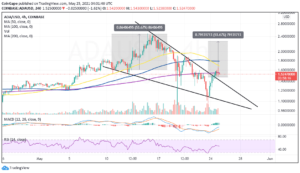
Ever since the low of $29,000 was set, Bitcoin has surged nearly 70% to $48,000. The BTC price action over the last week has formed a rising wedge, which is shown in light blue. This is a bearish pattern & will activate once price breaks the bottom trend of the pattern.
At the time of writing, BTC price has stalled at its major resistance zone found from $48,000- $50,000. For BTC to negate this bearish pattern it must break & hold this resistance zone. If this occurs , price will likely break the top trend of its rising wedge & potentially go on to surge past $50,000.
BTC Price Analysis: BTC/USDT 1 Day Chart
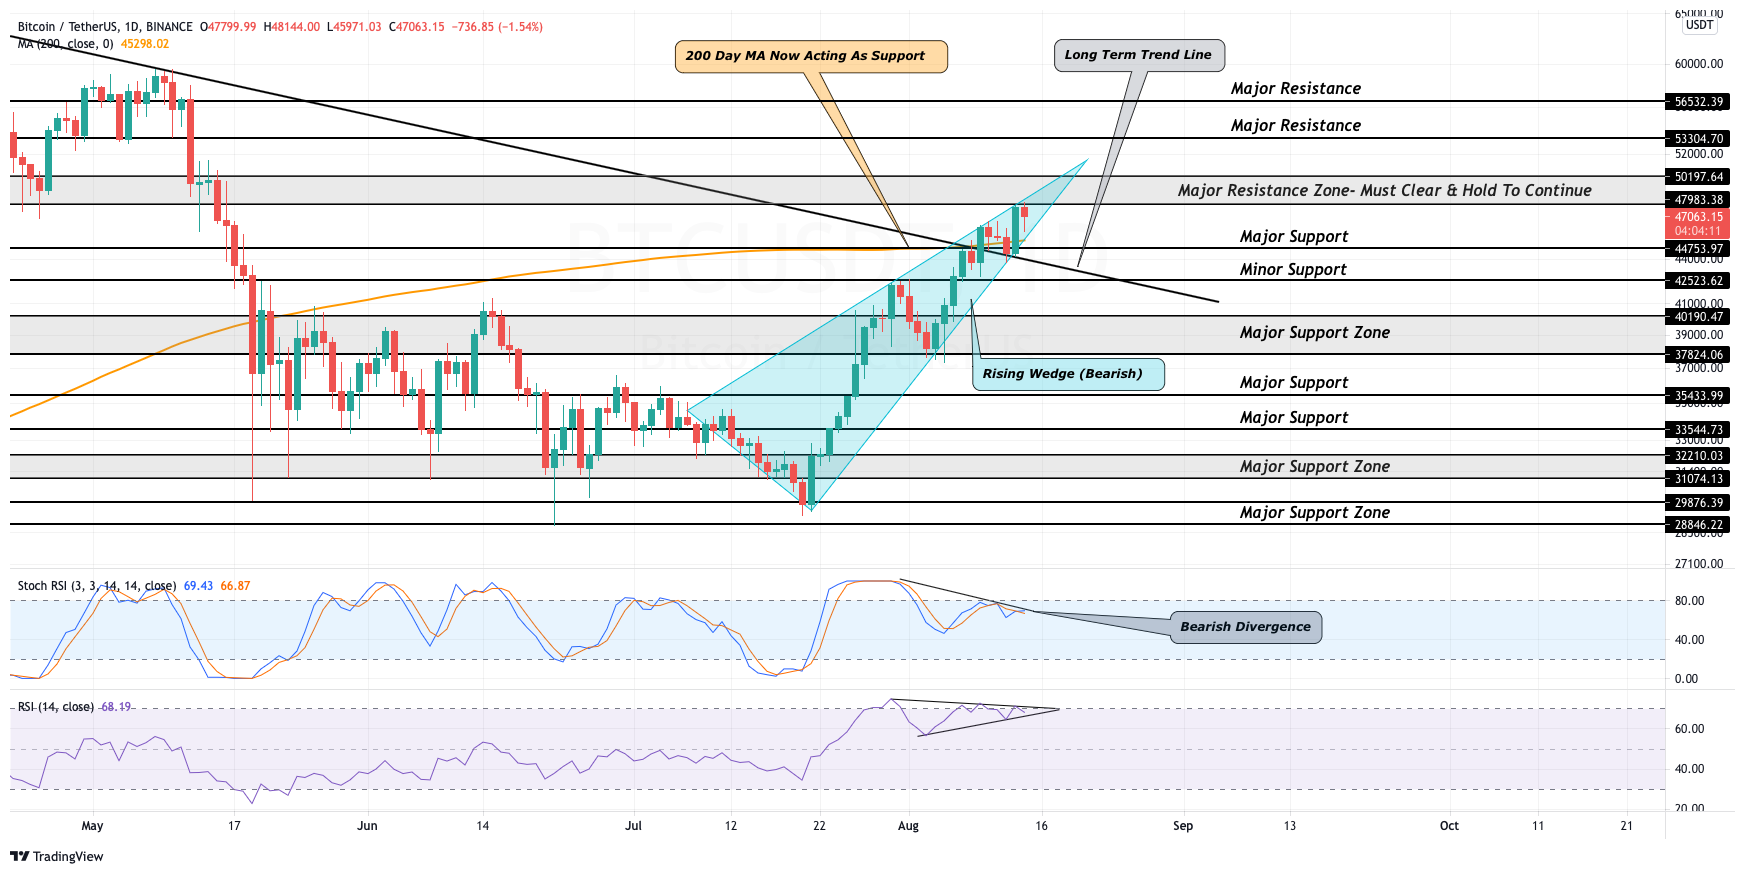
Just over the past week, bulls have managed to break two very important marks. The first being a long term trend line & the second being the 200MA which has acted as resistance for nearly 3 months. In the likely case that BTC fails to break over its major resistance zone, price will have support at $44,700, the long term trend line & the 200MA. All of these marks are in the same general area & breaking below these will cause a cascade of selling back to at minimum the minor support found at $42,500. The healthiest scenario would be for BTC to retrace back to the major support zone found at $38,000-$40,100. This would retest the previous two month resistance as support and will pave the way for $50,000+.
- The Stochastic RSI has been attempting to reenter the overbought territory but has failed to do so the last few days. This has created a bearish divergence which occurs when the price makes a higher high but strength makes a lower high.
- If strength breaks below the 50 value, BTC will likely revisit $42,000s.
- The regular RSI has also printed a bearish divergence & has formed a pennant the last few days. A break below the bottom trend will trigger the bearish rising wedge to play out.
BTC Intraday Analysis
- Spot rate: $47,000
- Trend: Bullish
- Volatility: High
- Support: $44,800
- Resistance: $48,000
Subscribe to our newsletter for free

- &
- 000
- 100
- Action
- All
- analysis
- AREA
- bearish
- Bitcoin
- BTC
- btc price
- BTC/USDT
- Bulls
- Cause
- Coingape
- Coins
- content
- continue
- cryptocurrencies
- day
- Finally
- financial
- First
- General
- High
- hold
- HTTPS
- investing
- IT
- lead
- light
- Line
- Long
- major
- Market
- market research
- months
- Near
- Newsletter
- Opinion
- Pattern
- price
- Price Analysis
- range
- research
- set
- Share
- Short
- So
- Steam
- support
- surge
- time
- top
- Traders
- value
- week
- writing