- USD/JPY’s two weeks rally ex-post BoJ’s flexible YCC implementation has almost reached a key resistance zone of 145.50/146.10.
- Rising of concerns about another bout of verbal FX interventions from Ministry of Finance officials to talk down the USD/JPY at around the 145.00 psychological level.
- Short-term momentum has turned bearish, risk of downside mean reversion towards the 20-day moving average now acting as support at 141.85.
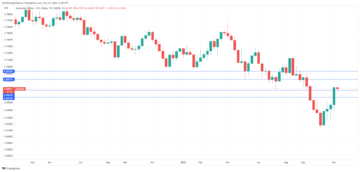
The ex-post effect of Bank of Japan (BoJ)’s flexible 10-year Japanese Government Bond (JGB) Yield Curve Control (YCC) announcement on the 28 July monetary policy meeting has led to a 716 pips rally (+5.2%) seen in the USD / JPY from its 28 July low of 138.55 to today, 14 August Asian session intraday high of 145.22.
Interestingly, the current intraday high of 145.22 coincided with a recent medium-term swing high of 145.07 printed on 30 June 2023 that witnessed drummed-up verbal FX intervention from Japan’s Ministry of Finance (MoF) officials to smooth out JPY weakness at the 145.00 psychology level of USD/JPY in the past.
No signs of verbal intervention so far from MoF officials, but current intraday price actions seen in today’s Asian session have suggested that such fears are rising in the marketplace, USD/JPY has attempted to push higher at the start of today’s Japan session with an intraday high print of 145.22 but bulls were not able to maintain their posture and drifted lower to 144.86, and record a current intraday loss of -0.08% at this time of the writing.
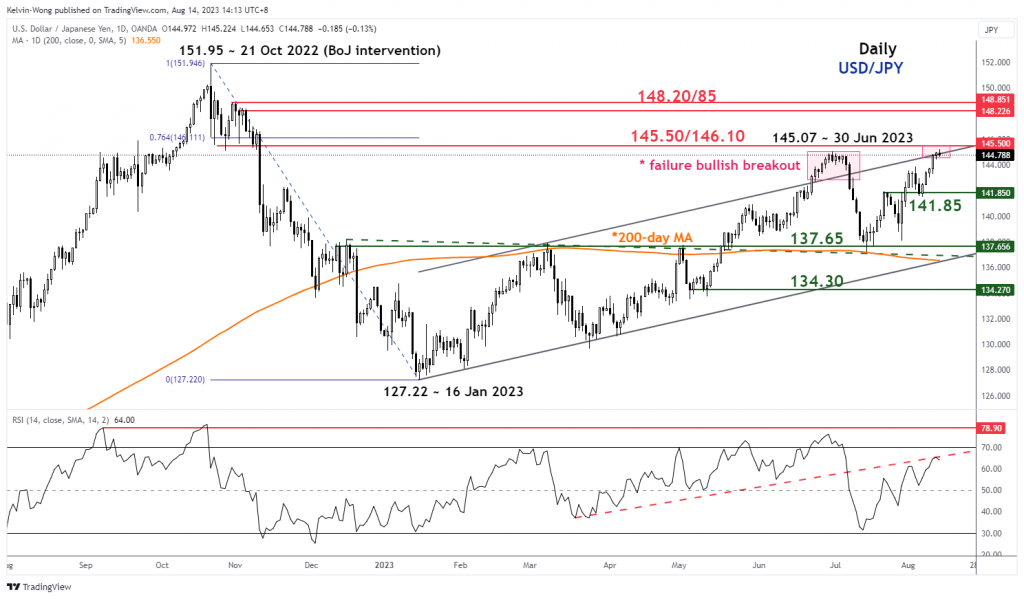
145.50/146.10 resistance is a key area of confluence
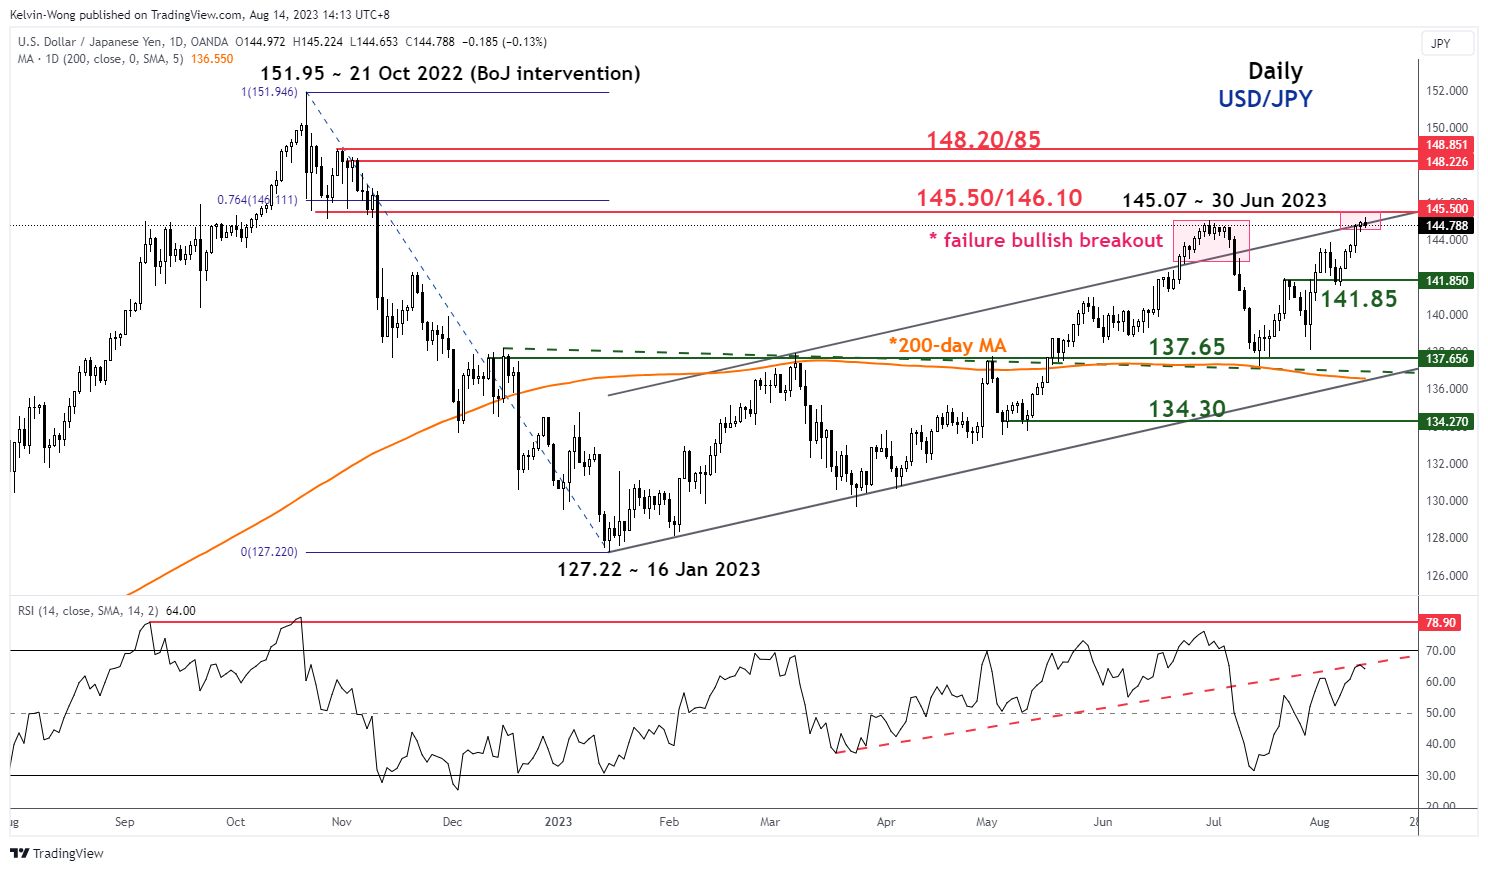
Fig 1: USD/JPY tendință pe termen mediu din 14 august 2023 (Sursa: TradingView, faceți clic pentru a mări graficul)
Today’s Asian session push-up in price actions has led the USD/JPY to retest the upper boundary of the medium-term ascending channel in place since the 16 January 2023 low of 127.22, the former swing low areas of 24 October/2 November 2022, and the 76.4% Fibonacci retracement of the prior medium-term downtrend phase from 21 October 2022 high to 16 January 2023 low which confluences at the 145.50/141.10 resistance zone.
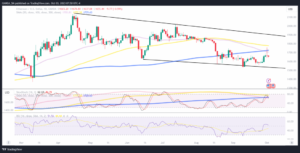
Momentul pe termen scurt a devenit urs
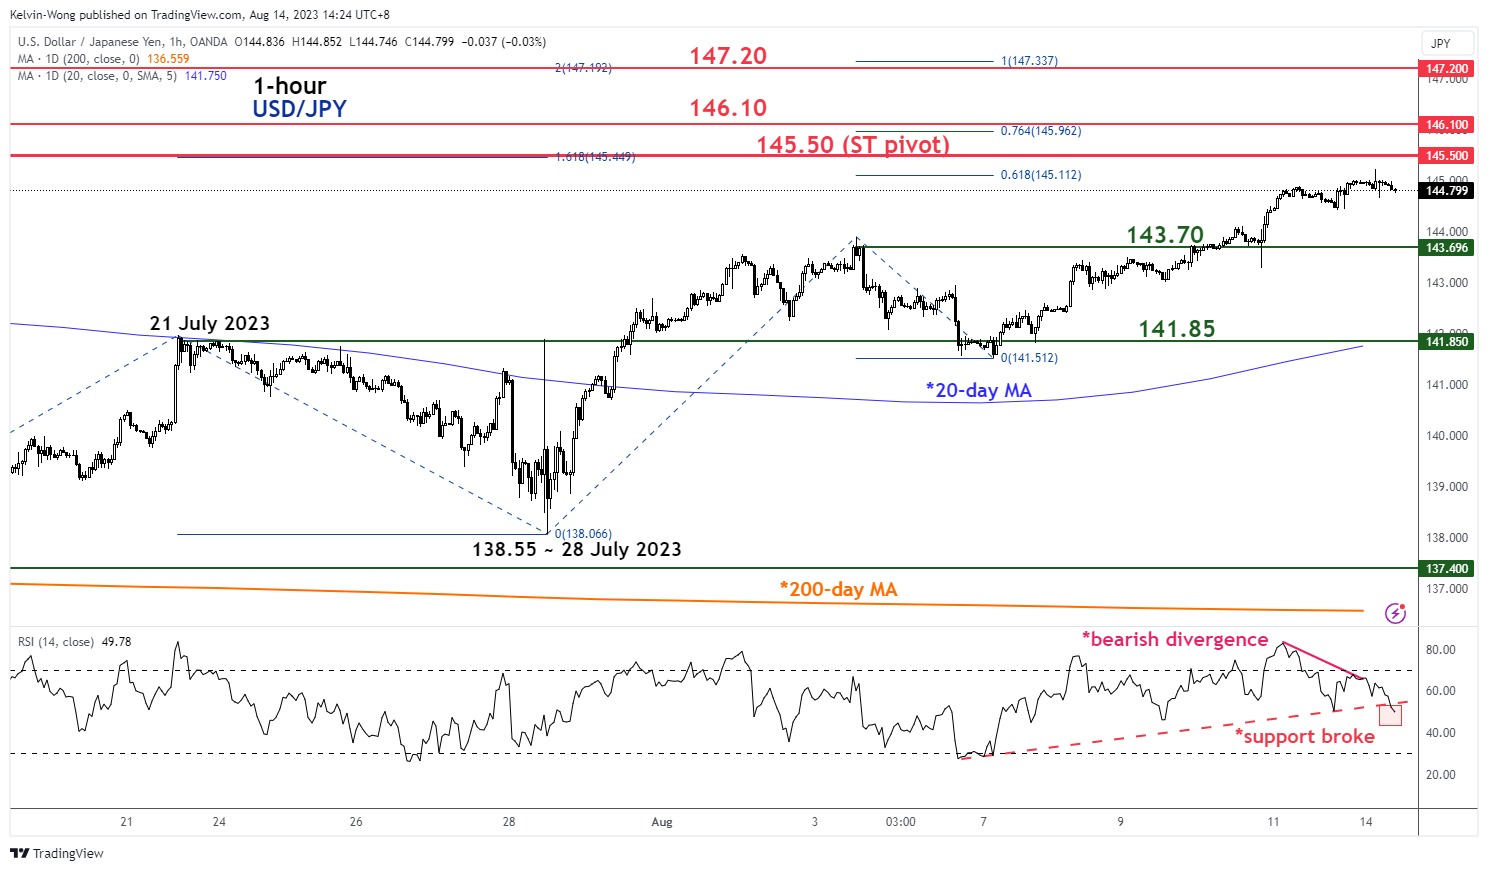
Fig 2: USD/JPY tendință minoră pe termen scurt din 14 august 2023 (Sursa: TradingView, faceți clic pentru a mări graficul)
The hourly RSI oscillator has started to stage a breakdown below its parallel ascending support at the 54 level after a prior bearish divergence condition was flashed out last Friday, 11 August.
Watch the 145.50 key short-term pivotal resistance and a break below the intermediate support of 143.70 exposes the next support at 141.85 (also the 20-day moving average).
On the other hand, a clearance above 145.50 sees 146.10 next, and a break above it may propel it higher toward the next resistance at 147.20 (Fibonacci extension cluster).
Conținutul are doar scop informativ general. Nu este un sfat de investiții sau o soluție de cumpărare sau vânzare de valori mobiliare. Opiniile sunt autorii; nu neapărat cel al OANDA Business Information & Services, Inc. sau al oricăruia dintre afiliații, filialele, funcționarii sau directorii săi. Dacă doriți să reproduceți sau să redistribuiți orice conținut găsit pe MarketPulse, un serviciu premiat de analiză valutară, mărfuri și indici globali și site de știri, produs de OANDA Business Information & Services, Inc., vă rugăm să accesați fluxul RSS sau să ne contactați la info@marketpulse.com. Vizita https://www.marketpulse.com/ pentru a afla mai multe despre ritmul piețelor globale. © 2023 OANDA Business Information & Services Inc.
Ultimele postări ale lui Kelvin Wong (vezi toate)
- Distribuție de conținut bazat pe SEO și PR. Amplifică-te astăzi.
- PlatoData.Network Vertical Generative Ai. Împuterniciți-vă. Accesați Aici.
- PlatoAiStream. Web3 Intelligence. Cunoștințe amplificate. Accesați Aici.
- PlatoESG. Automobile/VE-uri, carbon, CleanTech, Energie, Mediu inconjurator, Solar, Managementul deșeurilor. Accesați Aici.
- PlatoHealth. Biotehnologie și Inteligență pentru studii clinice. Accesați Aici.
- ChartPrime. Crește-ți jocul de tranzacționare cu ChartPrime. Accesați Aici.
- BlockOffsets. Modernizarea proprietății de compensare a mediului. Accesați Aici.
- Sursa: https://www.marketpulse.com/forex/usd-jpy-technical-lethargic-bulls-below-145-50/kwong
- :are
- :este
- :nu
- 07
- 1
- 10
- 11
- 14
- ani 15
- 15%
- 16
- 2%
- 20
- 2022
- 2023
- 22
- 24
- 28
- 30
- 50
- 70
- 700
- a
- Capabil
- Despre Noi
- mai sus
- acces
- actorie
- acțiuni
- plus
- sfat
- afiliate
- După
- de asemenea
- an
- analiză
- și
- Anunț
- O alta
- Orice
- SUNT
- ZONĂ
- domenii
- în jurul
- AS
- asiatic
- At
- a încercat să
- august
- August
- autor
- Autorii
- Avatar
- in medie
- acordare
- Bancă
- banca Japoniei
- de urs
- divergență bearish
- de mai jos
- BOJ
- legătură
- Cutie
- Pauză
- Defalcarea
- Bulls
- afaceri
- dar
- butoane
- cumpăra
- by
- Canal
- Diagramă
- clic
- Grup
- a coincis
- COM
- combinaţie
- Mărfuri
- preocupările
- condiție
- efectuat
- Conectarea
- contactați-ne
- conţinut
- Control
- cursuri
- Curent
- curba
- Directorii
- Divergență
- jos
- dezavantaj
- efect
- Elliott
- mări
- Eter (ETH)
- schimb
- experienţă
- expert
- extensie
- departe
- temeri
- Fibonacci
- finanţa
- financiar
- Găsi
- flexibil
- debit
- Pentru
- străin
- devize
- Forex
- Fost
- găsit
- Vineri
- din
- fond
- fundamental
- FX
- General
- Caritate
- piețele globale
- Guvern
- mână
- Avea
- Înalt
- superior
- HTTPS
- if
- implementarea
- in
- Inc
- Indici
- informații
- Intermediar
- intervenţie
- intervenții
- investiţie
- IT
- ESTE
- ianuarie
- Japonia
- Japonia
- Japonez
- JGB
- JPY
- iulie
- iunie
- Kelvin
- Cheie
- cheie rezistență
- Nume
- Led
- Nivel
- nivelurile de
- ca
- de pe
- Jos
- LOWER
- Macro
- menține
- Piață
- perspective de piață
- de cercetare de piață
- piaţă
- MarketPulse
- pieţe
- max-width
- Mai..
- însemna
- Revenire medie
- Reuniunea
- minister
- minor
- Impuls
- Monetar
- Politică monetară
- mai mult
- în mişcare
- media mobilă
- în mod necesar
- ştiri
- următor
- noiembrie
- acum
- numeroși
- octombrie
- of
- ofițerii
- Oficialii
- on
- afară
- Avize
- or
- Altele
- afară
- Perspectivă
- peste
- Paralel
- pasionat
- trecut
- perspective
- fază
- pivot
- Loc
- Plato
- Informații despre date Platon
- PlatoData
- "vă rog"
- Politica
- poziţionare
- postări
- preţ
- anterior
- Produs
- Propulsa
- furnizarea
- Psihologie
- scopuri
- Împinge
- raliu
- atins
- recent
- record
- cercetare
- Rezistență
- cu amănuntul
- retragerea
- Inversare
- în creștere
- Risc
- RSI
- RSS
- Titluri de valoare
- văzut
- vede
- vinde
- senior
- serviciu
- Servicii
- sesiune
- partajarea
- Pe termen scurt
- Semne
- întrucât
- Singapore
- teren
- netezi
- So
- până acum
- soluţie
- Sursă
- specializata
- Etapă
- Începe
- început
- stoc
- Piețele de acțiuni
- Strateg
- astfel de
- a sustine
- Leagăn
- Vorbi
- Tehnic
- Analiza Tehnica
- zece
- acea
- lor
- acest
- mii
- timp
- la
- astăzi
- azi
- spre
- față de
- Comercianti
- Trading
- TradingView
- Pregătire
- tendință
- transformat
- Două
- unic
- us
- USD / JPY
- folosind
- v1
- Vizita
- a fost
- Val
- slăbiciune
- săptămâni
- BINE
- au fost
- care
- câștigător
- cu
- asistat
- wong
- ar
- scris
- ani
- Randament
- curba de randament
- controlul curbei de randament
- tu
- zephyrnet