Published 1 hour ago
XRP Price Prediction: The ongoing correction is XRP price hits a minor roadblock after retesting local support of $0.44. The aforementioned support associated with the 50% Fibonacci retracement level creates a strong footing for buyers to recuperate bullish momentum. Thus, the reversal signs observed at this support give additional confirmation for potential price recovery. Here’s how you may trade amid the increasing negative sentiment in the market.
advertisement
Key Points:
- The ongoing correction in the XRP price will continue until the resistance trendline is intact
- Multiple technical levels accumulated near the $0.44 created high concentrated support zone
- The intraday trading volume in the XRP is $1.05 Billion, indicating a 16.9% loss.
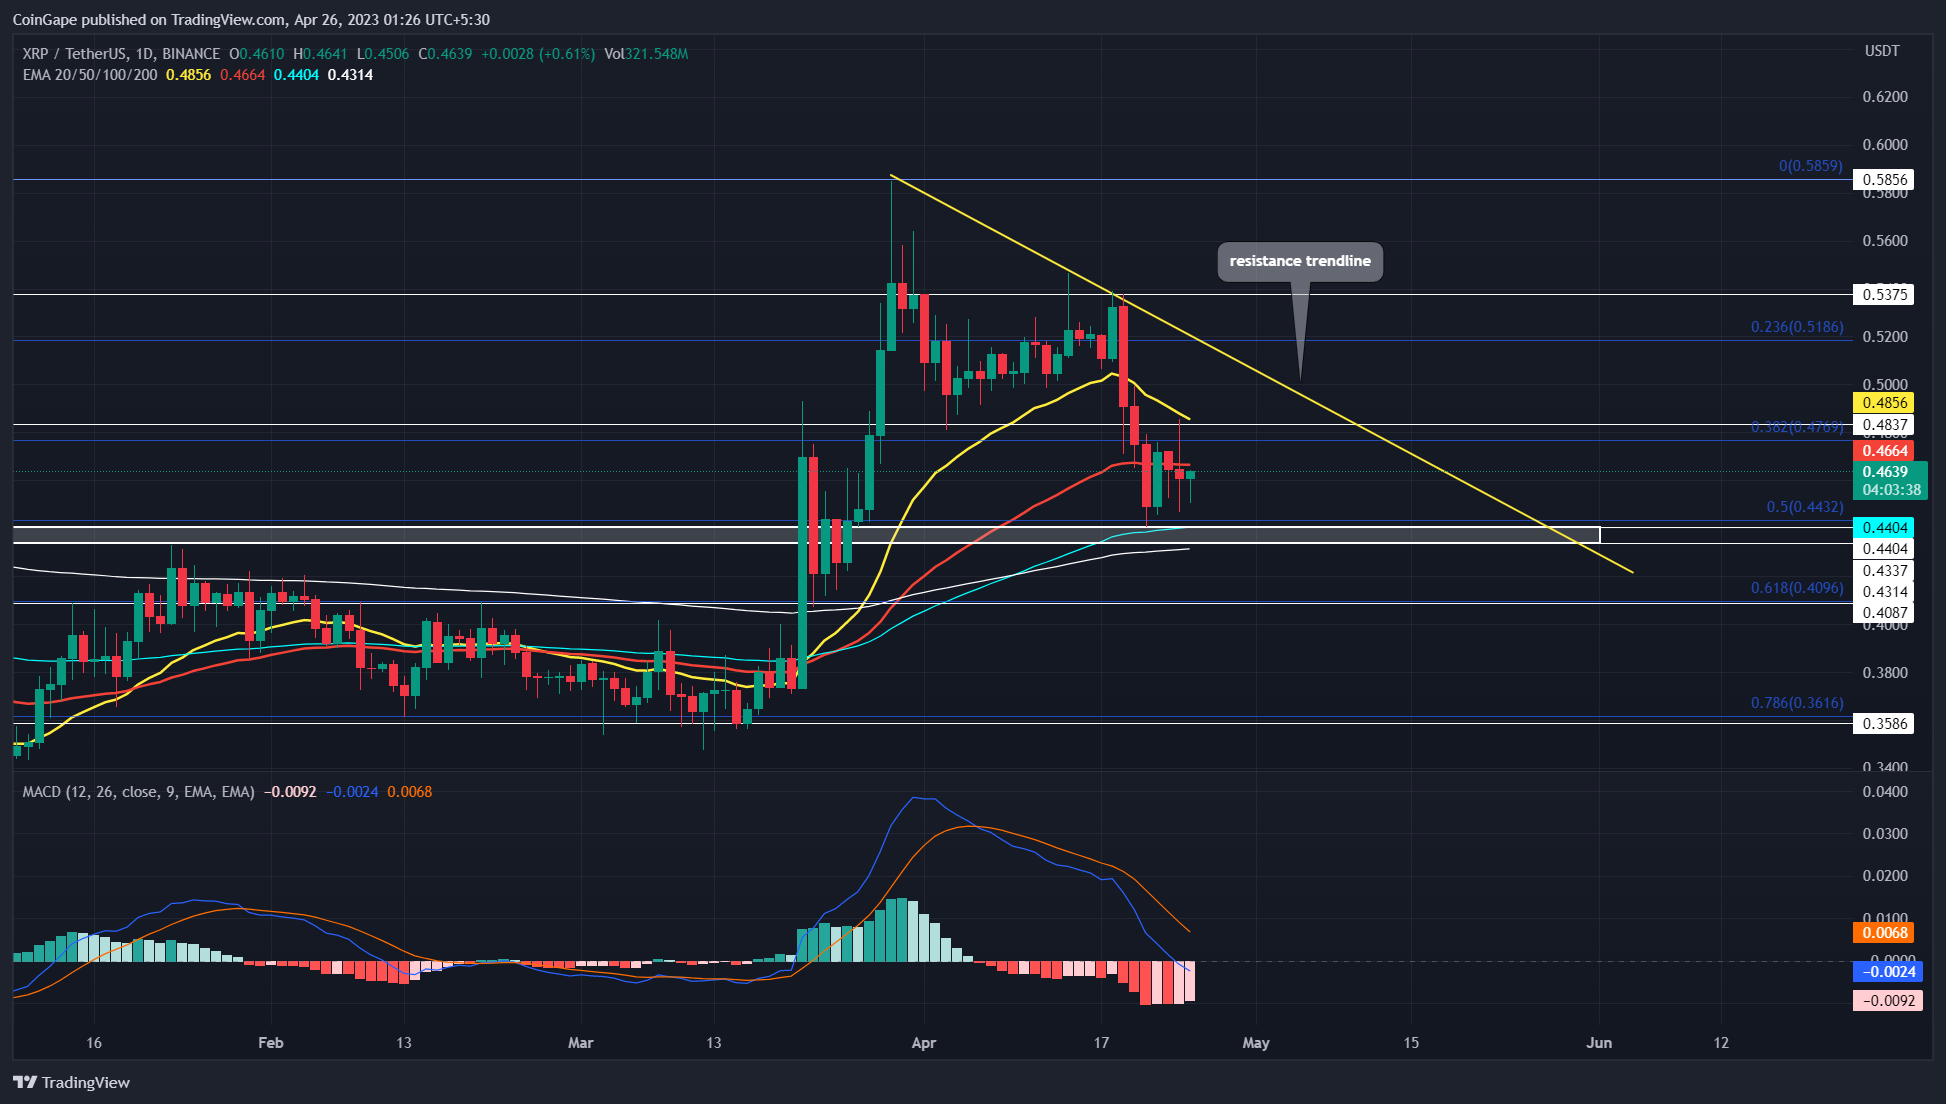
Source- Tradingview
After the aggressive sell-off last week, the XRP price turned sideways above the $0.44 support. Moreover, the lateral movement shows a few lower price rejection candles indicating the buyers are actively defending this level.
Furthermore, a correction phase to the 50% retracement level is considered healthy and the price holds a strong possibility to resume prior recovery. The aforementioned rejection candles show an early sign of reversal that may bolster the XRP price to rise 5% and hit the $0.484 barrier.
Trending Stories
Also Read: 280 Mln XRP On The Move; Whales Await XRP Price Surge
In addition, the technical chart shows a new resistance trendline trying to undermine the bullish momentum and prolong an ongoing correction. Thus, a potential reversal may gain an additional confirmation for recovery once the price breaches the overhead trendline.
This possible breakout assists buyers to drive the XRP price back to $0.585 high.
On a contrary note, a breakdown below 50% retracement will gradually weaken the bullish thesis.
Technical indicator
Moving Average Convergence Divergence: Despite a significant correction, the MACD(blue) and the signal(orange) line moving above the midline reflects the overall market trend is bullish
EMAs: The 100-and-200-day EMAs wavering near the $0.44 mark increases the support strength of this level.
XRP Intraday Price Levels
- Spot price: $0.46
- Trend: Bullish
- Volatility: High
- Resistance level- $0.48 and $0.5
- Support level- $0.44 and $0.4
Share this article on:
advertisement
The presented content may include the personal opinion of the author and is subject to market condition. Do your market research before investing in cryptocurrencies. The author or the publication does not hold any responsibility for your personal financial loss.
- SEO Powered Content & PR Distribution. Get Amplified Today.
- PlatoAiStream. Web3 Data Intelligence. Knowledge Amplified. Access Here.
- Minting the Future w Adryenn Ashley. Access Here.
- Source: https://coingape.com/markets/xrp-price-prediction-xrp-price-correction-halts-at-a-crucial-fibonacci-support-will-recovery-kickstart/
- :is
- :not
- 1
- 10
- 20
- 7
- 8
- 9
- a
- above
- Accumulated
- actively
- Ad
- addition
- Additional
- After
- aggressive
- Amid
- an
- and
- any
- ARE
- article
- assists
- associated
- At
- author
- avatar
- average
- await
- back
- banner
- barrier
- Beauty
- before
- below
- Billion
- blockchain
- Blue
- bolster
- breaches
- Breakdown
- breakout
- Brian
- Bullish
- buyers
- Candles
- Chart
- Coingape
- COM
- Concentrated
- condition
- confirmation
- considered
- content
- continue
- contrary
- Convergence
- correction phase
- created
- creates
- crucial
- crypto
- Crypto News
- cryptocurrencies
- cryptocurrency
- Defending
- different
- Divergence
- do
- drive
- Early
- Entertainment
- Ether (ETH)
- Fashion
- few
- Fibonacci
- finance
- financial
- follow
- For
- from
- Gain
- Give
- gradually
- Have
- healthy
- High
- Hit
- Hits
- hold
- holds
- How
- HTTPS
- i
- in
- include
- Including
- Increases
- increasing
- indicating
- investing
- journalism
- jpg
- Last
- Level
- levels
- Line
- local
- loss
- mark
- Market
- market research
- May..
- minor
- mln
- Momentum
- Moreover
- move
- movement
- moving
- Near
- negative
- New
- news
- of
- on
- ongoing
- Opinion
- or
- Orange
- overall
- past
- personal
- phase
- plato
- Plato Data Intelligence
- PlatoData
- plugin
- points
- possibility
- possible
- potential
- prediction
- presented
- price
- Price Prediction
- Prior
- Publication
- reach
- Read
- recovery
- reflects
- research
- Resistance
- responsibility
- resume
- retracement
- Reversal
- Ripple
- Rise
- sell-off
- sentiment
- Share
- show
- Shows
- sideways
- sign
- significant
- Signs
- strength
- strong
- subject
- support
- Technical
- that
- The
- this
- to
- Topics
- trade
- Trading
- trading volume
- TradingView
- Trend
- trending
- Turned
- Undermine
- variety
- volume
- week
- whales
- will
- with
- working
- written
- xrp
- XRP Price
- XRP price prediction
- years
- you
- Your
- zephyrnet