Published 11 hours ago
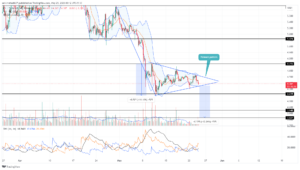
XRP Price Prediction: defying the recent recovery phase in the crypto market, the XRP coin price has witnessed a sustained downfall for nearly two months under the influence of a falling wedge pattern. The altcoin bounced off the pattern’s converging trendline multiple times indicating the traders are strictly respecting this pattern. Thus, the traders should also follow the potential target of this technical setup.
Key Points:
- A bearish reversal from the overhead trendline set XRP price for a 10% downfall
- The XRP price needs a bullish breakout from the overhead resistance trendline to recuperate the bullish recovery.
- The intraday trading volume in the XRP is $1.04 Billion, indicating a 34% loss.
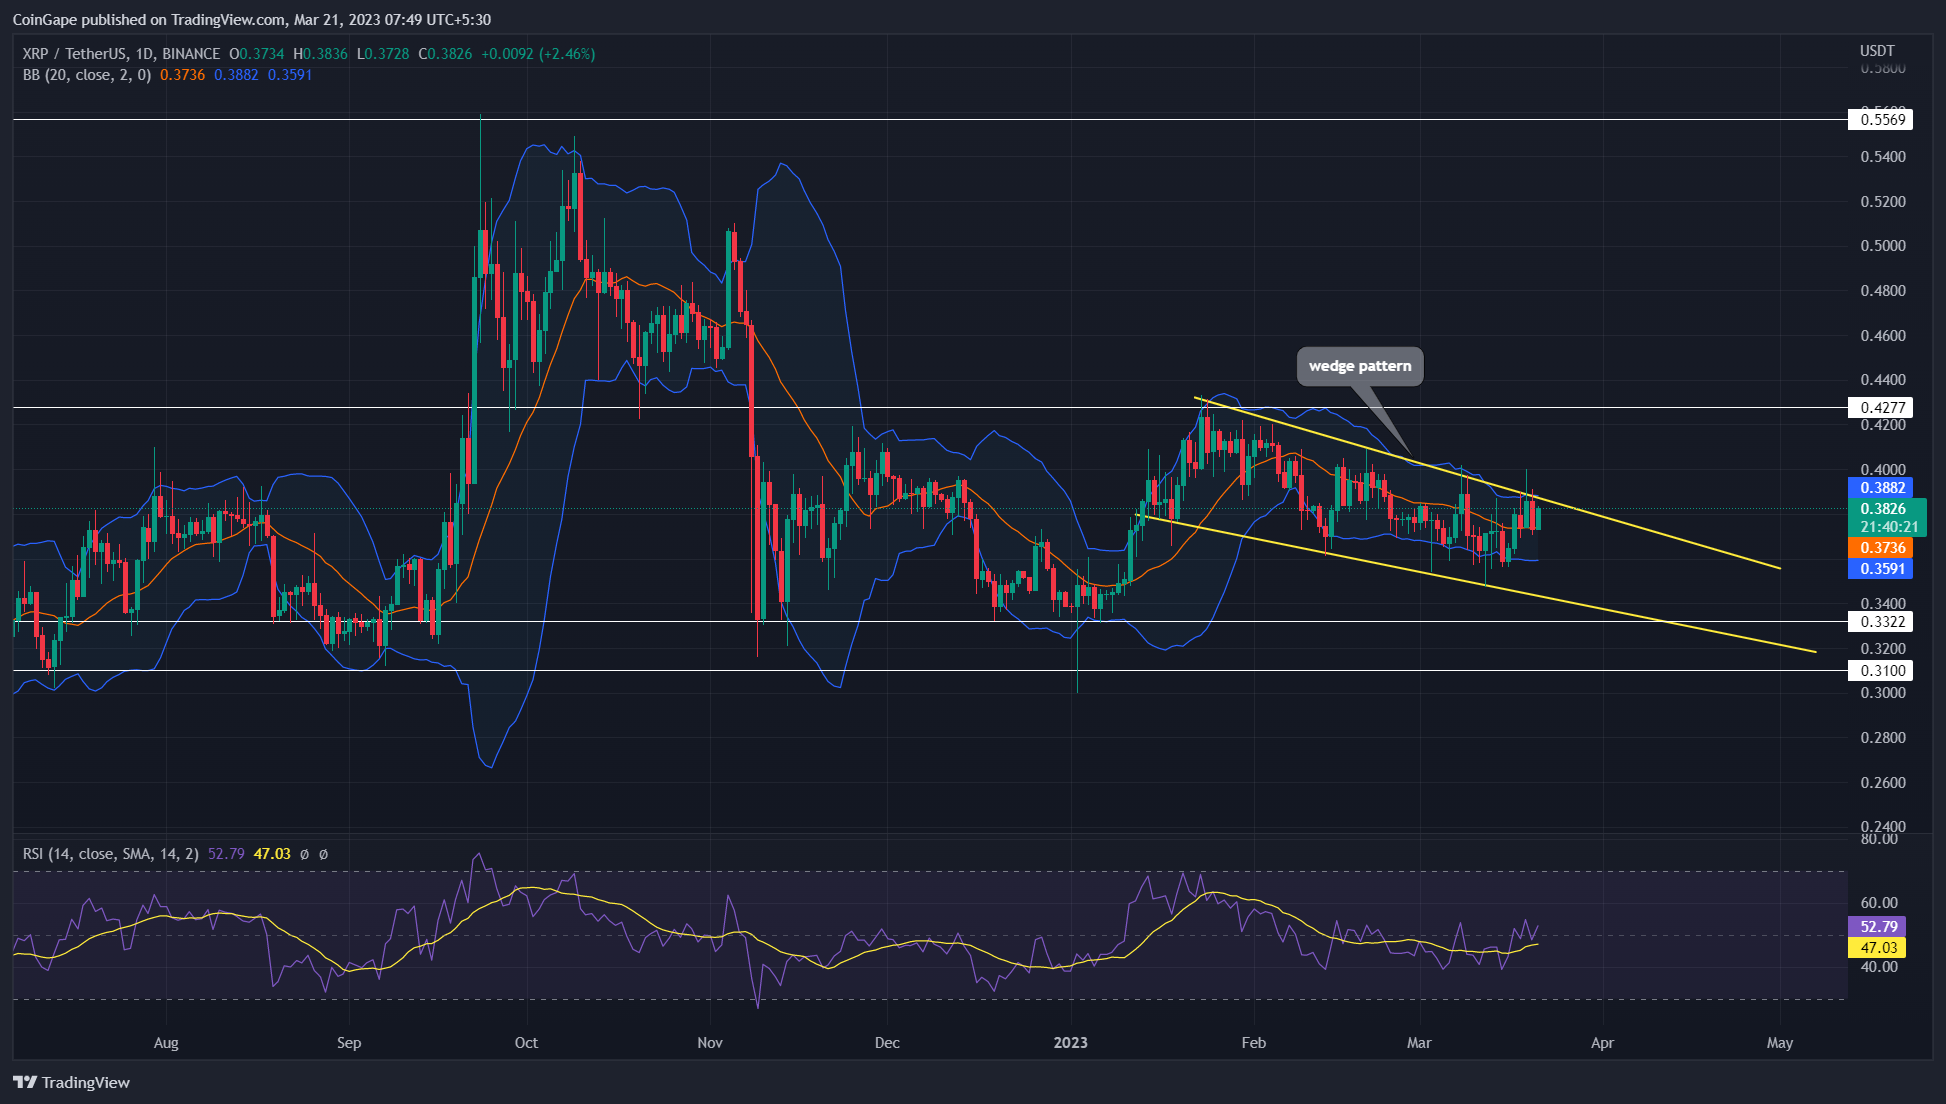
Source- Tradingview
The ongoing downfall in XRP price will continue until the falling wedge pattern is intact. The coin price witnessed several reversals from the pattern’s resistance trendline indicating the traders are aggressively selling on the bullish upswings which is one of the key traits of an established downtrend.
Trending Stories
Today, the XRP witnessed a 2.7% intraday gain showcasing another reversal from the overhead trendline. This bearish reversal hints at an upcoming bear cycle within the pattern and prolongs the ongoing downfall.
This potential downfall could tumble the price by 8% where it could revisit the lower support trendline.
Also Read: Top 6 Liquid Staking Platforms On Ethereum
Anyhow, interested traders looking for an entry opportunity must wait for the XRP price to break the overhead resistance trendline. The potential breakout will project a signal for trend reversal and over a long position opportunity to traders.
Under the ideal bullish condition, a breakout from this resistance trendline offers a potential rally to the pattern’s peak swing high resistance which is at the $0.427 mark.
Technical Indicator
RSI: Contrary to the falling price action, the daily RSI slope moving sideways indicates growing bullish momentum will assist buyers to eventually breach the pattern’s resistance trendline.
Bollinger Band: the XRP price potential breakdown below the Bollinger band indicator’s midline indicates an additional confirmation for an upcoming downfall.
XRP Intraday Price Levels
- Spot price: $0.37
- Trend: Bearish
- Volatility: Medium
- Resistance level- $0.4 and $0.43
- Support level- $0.356 and $0.33
Share this article on:
advertisement
The presented content may include the personal opinion of the author and is subject to market condition. Do your market research before investing in cryptocurrencies. The author or the publication does not hold any responsibility for your personal financial loss.
- SEO Powered Content & PR Distribution. Get Amplified Today.
- Platoblockchain. Web3 Metaverse Intelligence. Knowledge Amplified. Access Here.
- Source: https://coingape.com/markets/xrp-price-prediction-is-xrp-coin-ready-to-initiate-its-next-recovery-cycle/
- :is
- 1
- 10
- 11
- 7
- 8
- 9
- a
- Action
- Ad
- Additional
- Altcoin
- and
- Another
- ARE
- article
- assist
- At
- author
- avatar
- BAND
- banner
- Bear
- bearish
- Beauty
- before
- below
- Billion
- blockchain
- breach
- Break
- Breakdown
- breakout
- Brian
- Bullish
- buyers
- by
- Coin
- Coingape
- COM
- condition
- content
- continue
- contrary
- converging
- could
- crypto
- Crypto Market
- cryptocurrencies
- cryptocurrency
- cycle
- daily
- different
- downfall
- Entertainment
- entry
- established
- Ether (ETH)
- eventually
- Falling
- Fashion
- finance
- financial
- follow
- For
- from
- Gain
- Growing
- Have
- High
- hints
- hold
- HOURS
- HTTPS
- i
- ideal
- in
- include
- Including
- indicates
- indicating
- influence
- initiate
- interested
- investing
- IT
- ITS
- journalism
- jpg
- Key
- Last
- Liquid
- liquid staking
- Long
- looking
- loss
- mark
- Market
- market research
- Momentum
- months
- moving
- multiple
- nearly
- needs
- next
- of
- Offers
- on
- ONE
- ongoing
- Opinion
- Opportunity
- past
- Pattern
- Peak
- personal
- phase
- Platforms
- plato
- Plato Data Intelligence
- PlatoData
- plugin
- points
- position
- potential
- prediction
- presented
- price
- PRICE ACTION
- Price Prediction
- project
- Project A
- Publication
- rally
- Read
- ready
- recent
- recovery
- research
- Resistance
- respecting
- responsibility
- Reversal
- Selling
- set
- setup
- several
- Share
- should
- showcasing
- sideways
- Signal
- Staking
- subject
- support
- Target
- Technical
- The
- times
- to
- Topics
- Traders
- Trading
- trading volume
- TradingView
- Trend
- trending
- under
- upcoming
- variety
- volume
- wait
- which
- will
- within
- witnessed
- working
- written
- xrp
- xrp coin
- XRP Price
- XRP price prediction
- years
- Your
- zephyrnet