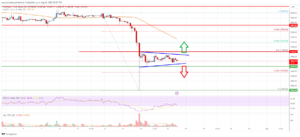
- Stellar lumen price is facing a major resistance near the $0.095 zone against the US Dollar.
- XLM price is now trading above $0.090 and the 55 simple moving average (4-hours).
- There is a key bullish trend line forming with support near $0.0900 on the 4-hours chart (data feed via Kraken).
- The pair could start a decent increase if it clears the $0.0935 and $0.095 resistance levels.
Stellar lumen price is trading above $0.0900 against the US Dollar, similar to bitcoin. XLM price must stay above the $0.0840 support to rise further.
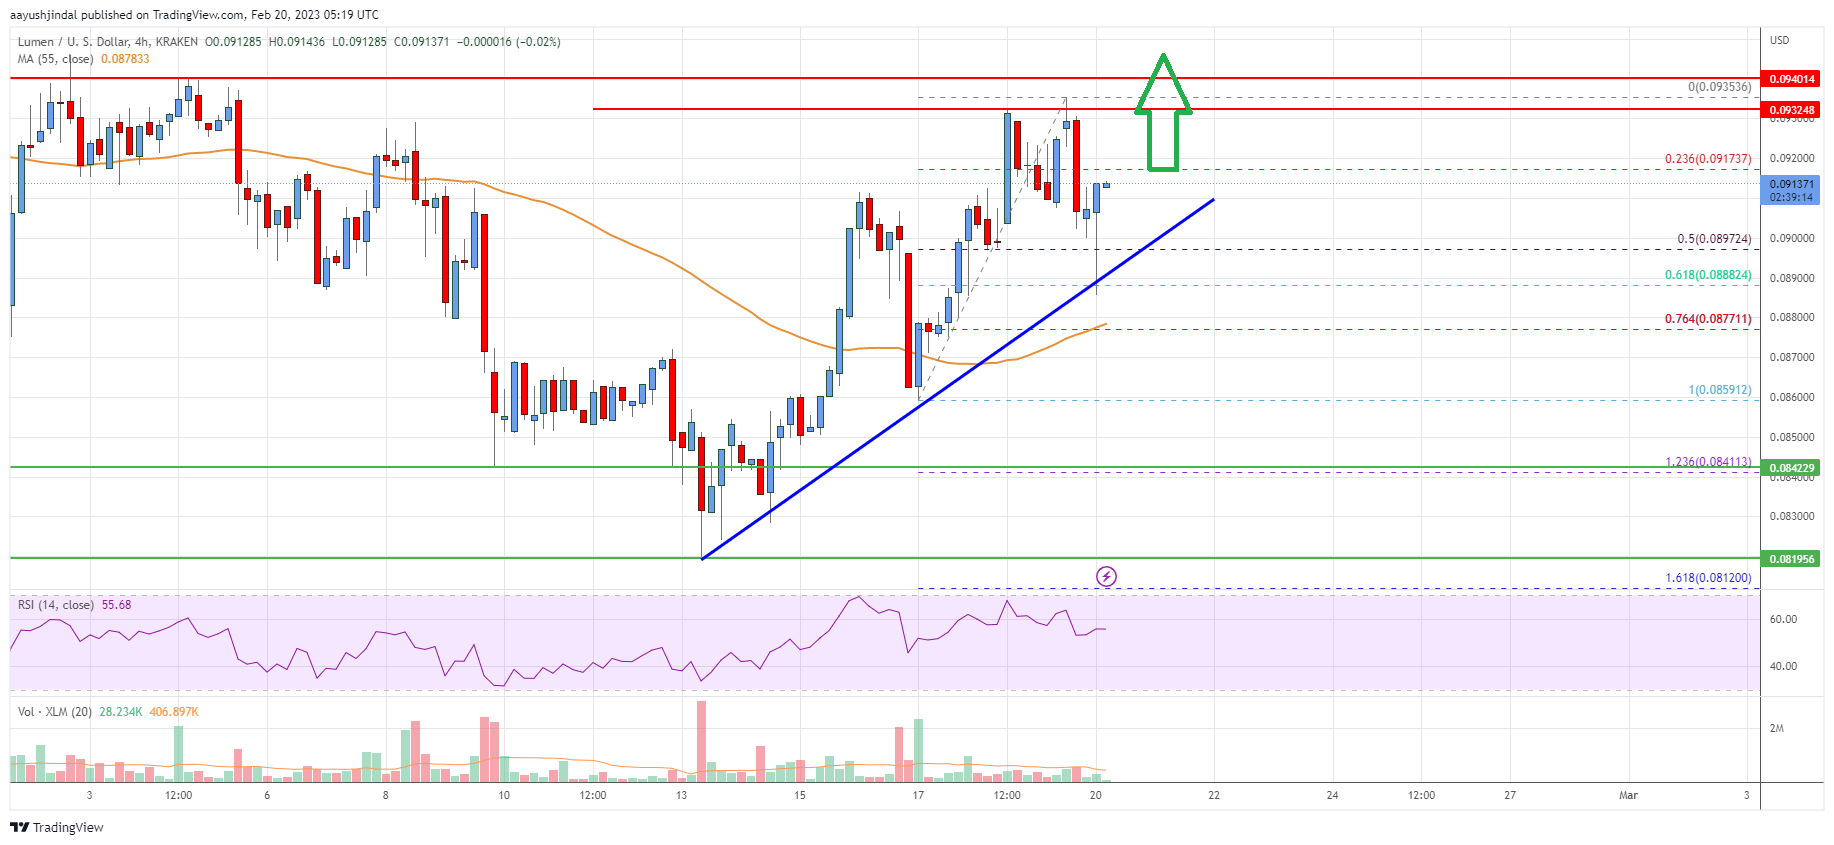
Stellar Lumen Price Analysis (XLM to USD)
After forming a base above the $0.0820 level, stellar lumen price started a fresh increase against the US Dollar. The XLM/USD pair broke the $0.085 resistance zone to move into a positive zone.
The price even cleared the $0.0880 resistance and the 55 simple moving average (4-hours). A high was formed near $0.0935 before there was a minor downside correction. The price declined below the $0.0920 level. It even spiked below the 50% Fib retracement level of the upward move from the $0.0859 swing low to $0.0935 high.
The price is now trading above the $0.090 level and the 55 simple moving average (4-hours). On the upside, the price is facing resistance near the $0.0935 level.
The next major resistance is near the $0.0950 level. A clear move above the $0.0950 level might send the price towards the $0.100 level. Any more gains could lead the price towards the $0.1080 level or even $0.1120 in the coming days.
An initial support on the downside is near the $0.0900 level. There is also a key bullish trend line forming with support near $0.0900 on the 4-hours chart.
The next major support sits near the $0.0880 level or the 76.4% Fib retracement level of the upward move from the $0.0859 swing low to $0.0935 high. The main support is near the $0.0840 zone. Any more losses could lead the price towards the $0.082 level in the near term, below which the price might even retest $0.080.
Stellar Lumen (XLM) Price
The chart indicates that XLM price is now trading above $0.0900 and the 55 simple moving average (4-hours). Overall, the price could start a decent increase if it clears the $0.0935 and $0.095 resistance levels.
Technical Indicators
4 hours MACD – The MACD for XLM/USD is gaining momentum in the bullish zone.
4 hours RSI – The RSI for XLM/USD is now above the 50 level.
Key Support Levels – $0.0900 and $0.0880.
Key Resistance Levels – $0.0935, $0.0950 and $0.100.
- SEO Powered Content & PR Distribution. Get Amplified Today.
- Platoblockchain. Web3 Metaverse Intelligence. Knowledge Amplified. Access Here.
- Source: https://www.livebitcoinnews.com/stellar-lumen-xlm-price-aims-key-upside-break-above-0-10/
- 10
- 100
- a
- above
- against
- aims
- analysis
- and
- average
- base
- before
- below
- Break
- Broke
- Bullish
- Chart
- clear
- coming
- comments
- could
- data
- Days
- Dollar
- downside
- Even
- facing
- follow
- formed
- fresh
- fresh increase
- from
- further
- gaining
- Gains
- High
- HOURS
- HTTPS
- in
- Increase
- indicates
- initial
- internal
- IT
- Key
- Kraken
- lead
- Level
- levels
- Line
- losses
- Low
- Lumen
- MACD
- Main
- major
- might
- minor
- Momentum
- more
- move
- moving
- moving average
- Near
- next
- overall
- plato
- Plato Data Intelligence
- PlatoData
- positive
- Post
- price
- Price Analysis
- Resistance
- retracement
- Rise
- rsi
- similar
- Simple
- start
- started
- stay
- Stellar
- Stellar Lumen
- support
- support levels
- TAG
- The
- to
- towards
- Trading
- TradingView
- Trend
- Upside
- upward
- us
- US Dollar
- USD
- via
- which
- XLM
- xlm price
- XLM/USD
- zephyrnet