In January 2022, I wrote about SACCR:
Bank Capital. A bank will typically have one of two constraints – either Leverage Ratio or Credit RWAs. This is because a bank has to hold a given pot of capital versus its exposures, and these exposures are not necessarily additive. It simply has to hold enough tier one capital (typically equity, with some convertible debt) to satisfy the highest of the two requirements. For example, a bank may hold 7.5% Tier 1 capital versus it’s exposures as calculated under the leverage ratio, and 15% Tier 1 capital versus its total Risk Weighted Assets (of which Credit RWAs are one component). They do not then hold a total of 22.5% Tier 1 capital versus their exposures. The same Tier 1 capital is counted in each ratio – essentially the numerator is the same, the denominator changes.
Clarus: MECHANICS AND DEFINITIONS OF SA-CCR (PART 1)
That was our most popular blog of 2022. But did it go far enough? I followed it up with further SACCR blogs (and our first podcast!), all of which are linked below:
But today, I don’t want to rehash old ground. And no, you do not need to go through the old blogs to (hopefully) learn something from today’s blog.
Rather, today I want to shed some light on headlines that state things like:
US banks with large forwards and swaps books may feel a materially larger impact than European banks that are not constrained by any kinds of capital floors and are generally less RWA restrained.
Risk.net: https://www.risk.net/derivatives/7907246/sa-ccr-brings-little-succour-for-fx-dealers-and-clients
And;
“It’s much more expensive for us to price forwards and swaps,” said Wilkins. “A certain amount of that increased cost we can absorb as an organisation, and after a while, we then pass that on within the spread that we’re charging.”
Risk.net: https://www.risk.net/derivatives/7951096/european-banks-cant-escape-sa-ccr-hit-warns-fx-exec
What does it mean to be “RWA restrained” for a bank? And how, exactly, do some costs get “absorbed”? We all know that dealers are not charities. So how does it work in practice?
Let’s talk FX
The following examples apply just as well for exposures in Rates, Credit, Equities or Commodities as they do in FX markets. The reasons that FX tends to be the main focus of SACCR stories are plenty, including:
- The move to SACCR from CEM moves the pain from large gross notional positions (i.e. Rates) to large directional positions. Most firms will be directional in some FX pairs (if not all of them).
- All FX positions are now captured. Previously, some sub-1 year FX positions were exempt from capital requirements.
- Some FX market participants do not collateralise their trades – i.e. they do not post VM. (Remember that physical FX trades are exempt from IM as well). Uncollateralised trades attract penal capital charges under SACCR by increasing the Maturity Factor.
- FX markets are largely bilateral, therefore they do not enjoy the benefits of a multilateral netting node – such as a CCP. This means that bilateral positions are grossed up (across both counterparties and currency pairs), increasing exposures under SACCR.
- FX is volatile! There is nothing new there, but it means that the “Replacement Cost” – the mark to market of a position net of the collateral held – can be really high. Okay, these can be really high for long-dated positions in Rates, Credit etc, but this RC is more likely to be uncollateralised in FX markets. Under SACCR, the RC attracts a 140% alpha “multiplier” (with much debate around this in Europe), which was not present under previous capital calculations.
With those observations stated upfront, let’s move to helping readers understand how bank capital works and why some banks will be “leverage constrained” whilst others are “RWA constrained”.
How Does Bank Capital Work?
It is very simple really! There are 3 steps:
- Calculate exposures.
- Decide how much capital you want to hold against these exposures.
- Make sure the amount of capital you hold is over and above the regulatory-prescribed minimums.
SACCR deals with how we calculate the exposures. How much capital to hold will depend on who a bank considers its peers, what the shareholders demand and how much of a safety buffer they want to incorporate. Larger capital buffers result in lower funding costs (largely speaking), but then a lower return on equity compared to “peers”. It is really a business decision to make, albeit there are regulatory minimums which must be met.
If we take some typical inputs, I would estimate that a large bank might target:
- 12.5% Tier One capital against Risk Weighted Assets.
- 7.5% Leverage Ratio.
- 12% Return on Equity – i.e. every dollar of capital “costs” 12% as it is not being used anywhere else to deliver a return.
As our readers will recall, FX trades attract the following inputs for SACCR:
| Net notional per currency pair per counterparty | $Xm |
| Maturity Factor CSA with <5,000 trades, clean CSA | 0.30 |
| Supervisory Factor for FX Trades | 4% |
| Alpha | 1.4 |
| Calculation | X * 0.30 * 4% * 1.4 |
| Exposure at Default (EAD) | $Ym |
Hypothetical Portfolio
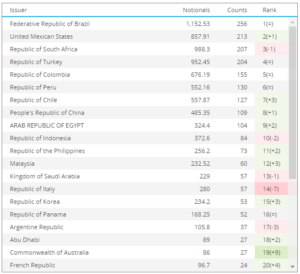
Let us now take a typical bilateral portfolio. I am a bank, facing four other banks (CP1-4) across 4 major currency pairs.
Using the SACCR inputs from the table above, I arrive at the following situation:
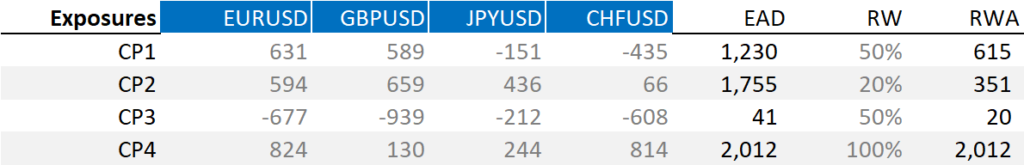
Table 2 shows;
- EAD (Exposure at Default) calculated for each counterparty by “grossing up” the net risk across currency pairs, multiplied by the inputs from Table 1.
- RWAs, arrived at by EAD multiplied by the Risk Weight per counterparty.
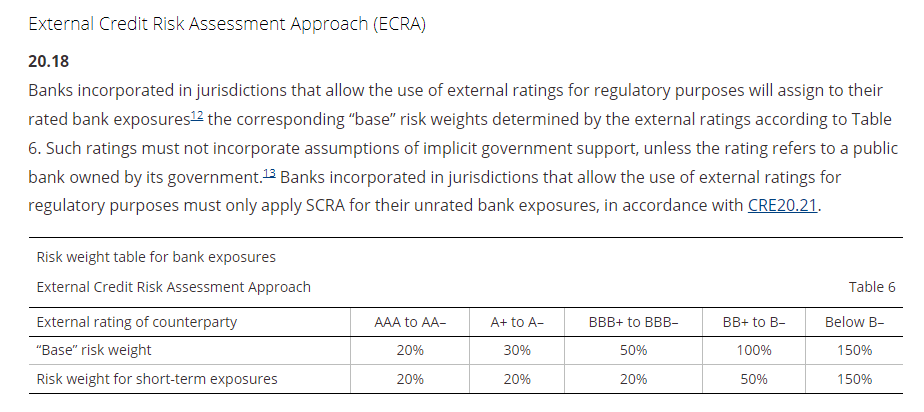
- Risk weights can be found under CRE20, such as:
- Table 2 assumes that all trades are collateralised, and that the “replacement cost” is incorporated into the Exposures per currency pair already (this is a simplification, but works nicely for presentation purposes).
We therefore see the following exposure and capital calculations for this portfolio:

Table 4 shows;
- A total EAD of ~$5bn for this portfolio.
- This reduces to Credit RWAs of ~$3bn, due to most counterparties having risk weights less than 100%.
- Using our 7.5% (LR) or 12.5% (RWA) capital ratios, results in this particular portfolio being constrained by Leverage Ratio.
However, using exactly the same inputs, if the exposures move around the counterparties, this portfolio can just as simply become RWA Constrained:
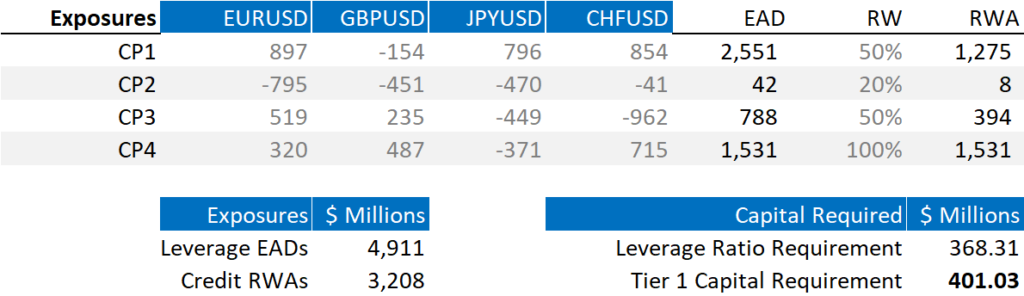
Table 5 shows that if a more significant percentage of the overall EADs are moved to CP4, which has the highest Risk Weight, the capital constraint now moves to Credit RWAs.
Do You Need more Examples?
I could repeat this exercise ad-nauseum, even showing how the distribution of identical exposures can be moved around the market to create different capital constraints. I would advise you to create your own spreadsheets, as outlined here, in a similar way as we stepped you through Excel for ISDA SIMM all of those years ago.
In Summary
- Bank capital is simple.
- When a bank now says that they are “leverage constrained” or “RWA constrained” this blog sheds light on what that actually means.
- It is a nice optimisation “problem” to consider.
- SEO Powered Content & PR Distribution. Get Amplified Today.
- Platoblockchain. Web3 Metaverse Intelligence. Knowledge Amplified. Access Here.
- Source: https://www.clarusft.com/now-everyone-can-understand-bank-capital-requirements/?utm_source=rss&utm_medium=rss&utm_campaign=now-everyone-can-understand-bank-capital-requirements
- 000
- 1
- 15%
- 2022
- 7
- a
- About
- above
- across
- actually
- After
- against
- All
- Alpha
- already
- amount
- and
- anywhere
- Apply
- around
- Assets
- Attracts
- Bank
- Banks
- because
- become
- being
- below
- benefits
- bis
- Blog
- blogs
- Books
- buffer
- business
- calculate
- calculated
- capital
- ccp
- certain
- Changes
- charges
- charging
- Charities
- Collateral
- Collateralised
- Commodities
- compared
- component
- Consider
- considers
- constraints
- Cost
- Costs
- could
- Counterparty
- create
- credit
- Currency
- currency pairs
- Deals
- debate
- Debt
- decision
- Default
- deliver
- Demand
- DID
- different
- distribution
- Dollar
- Dont
- each
- either
- enjoy
- enough
- Equities
- equity
- essentially
- estimate
- etc
- European
- Even
- Every
- everyone
- exactly
- example
- examples
- exempt
- Exercise
- expensive
- Exposure
- facing
- firms
- floors
- Focus
- followed
- following
- found
- Free
- from
- from capital
- funding
- further
- FX
- FX markets
- generally
- get
- given
- Go
- gross
- Ground
- having
- Headlines
- Held
- helping
- here
- High
- highest
- hold
- Hopefully
- How
- HTTPS
- Impact
- in
- Including
- incorporate
- Incorporated
- increased
- increasing
- informed
- IT
- January
- Know
- large
- largely
- larger
- LEARN
- Leverage
- light
- likely
- linked
- Main
- major
- major currency
- make
- mark
- Market
- Markets
- materially
- max-width
- means
- might
- more
- most
- Most Popular
- move
- moves
- multilateral
- multiplied
- necessarily
- Need
- net
- New
- Newsletter
- node
- Notional
- Okay
- Old
- ONE
- organisation
- Other
- Others
- outlined
- overall
- own
- Pain
- pairs
- part
- participants
- particular
- percentage
- physical
- plato
- Plato Data Intelligence
- PlatoData
- Plenty
- Popular
- portfolio
- position
- positions
- Post
- pot
- practice
- present
- presentation
- previous
- previously
- price
- purposes
- Rates
- ratio
- readers
- reasons
- reduces
- regulatory
- remember
- repeat
- Requirements
- result
- Results
- return
- Risk
- SA-CCR
- Safety
- Said
- same
- says
- Shareholders
- Shows
- significant
- similar
- Simple
- simply
- situation
- So
- some
- something
- speaking
- spread
- State
- stated
- Steps
- Stories
- subscribe
- such
- Swaps
- table
- Take
- Talk
- Target
- The
- The Capital
- their
- therefore
- things
- Through
- tier
- Tier One
- to
- today
- today’s
- Total
- trades
- typical
- typically
- under
- understand
- URL
- us
- Versus
- weight
- What
- which
- while
- Whilst
- WHO
- will
- within
- Work
- works
- would
- year
- years
- Your
- zephyrnet