Published 31 mins ago
Litecoin price jumps for the second straight day, despite a broader crypto market meltdown. LTC hovers in a range of $52.0 and $56.0 for the past few sessions. Bulls managed to take control from the lows of $52.0 and made a corrective pullback in today’s session from the highs of $56.54.
advertisement
We expect LTC to scale higher if the price is sustained above $57.50 on the daily chart.
- Litecoin price extends gains for the second straight day.
- The price must close above $57.50 on the daily chart with above-average volume to bring more gains.
- The 24-hour trading volume rose 6% at $502,835,776.
Litecoin price sentiment remains bullish
As shown in the daily chart LTC trades in a “Rising Channel”, forming higher highs and lows. Currently, the price is trading near the support level of the channel.
LTC took a deep dive from its recent swing high to its recent lows with a more than 20% fall, between August 14 to August 20.
Trending Stories
Further, it formed a “Double Bottom” pattern. In this case, we would set an entry order above the neckline of the bullish structure, which is ($57.50).
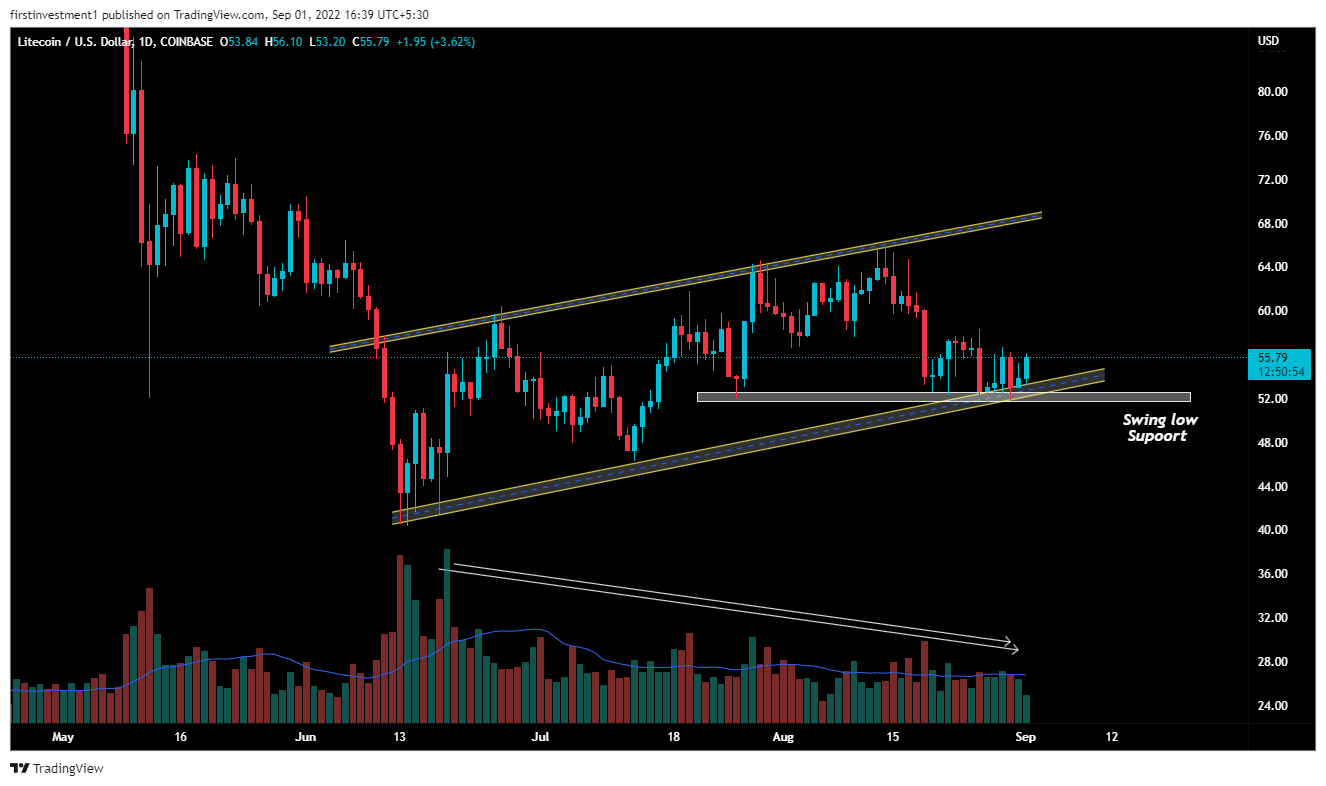
The price has been consolidating near its support level for the last two weeks, with declining volumes. The volumes are below the average line and falling, with the price moving sideways, implying accumulation near support. Big money is slowly entering a long trade while exiting short positions.
If the price closes above the session’s high, then we can expect the current bullish sentiment to stay. In that case, the first upside target would be the high of August 26 at $58.09 followed by the psychological $60.0 mark.
On the flip side, a spike in a sell order would drag the price toward $53.o.

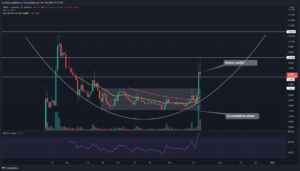
The formation of the “Falling Wedge” pattern on the four-hour chart, indicates some cautiousness. The falling wedge can be one of the most difficult chart patterns to accurately recognize and trade. When lower highs and lower lows form, as in a falling wedge, security remains in a downtrend. The falling wedge is designed to spot a decrease in downside momentum and alert technicians to a potential trend reversal.
Also read: http://This Shiba Token Emerges As Most Traded Token Among ETH Whales
According to this pattern, if the price sustains above this breakout level of $57.50, then we can enter a buy position.
The nearest support is the previous swing low ($52.0), whereas the nearest resistance could be found at ($57.50). There is a higher probability of the price breaking the resistance level.
advertisement
LTC looks bullish on all time frames. Above ($57.00) closing on the daily time frame, we can put a trade on the buy side.
Share this article on:
The presented content may include the personal opinion of the author and is subject to market condition. Do your market research before investing in cryptocurrencies. The author or the publication does not hold any responsibility for your personal financial loss.
- Bitcoin
- blockchain
- blockchain compliance
- blockchain conference
- coinbase
- Coingape
- coingenius
- Consensus
- crypto conference
- crypto mining
- cryptocurrency
- decentralized
- DeFi
- Digital Assets
- ethereum
- Litecoin price analysis
- machine learning
- non fungible token
- plato
- plato ai
- Plato Data Intelligence
- Platoblockchain
- PlatoData
- platogaming
- Polygon
- Price Analysis
- proof of stake
- W3
- zephyrnet