- SOFR Swaps at IDBs trade mainly as Spreadovers, Curves and Butterflys
- Market Share can be determined using trade count, notional or dv01
- Spreadovers are the largest and most important type
- In Spreadovers, ICAP has 50% share and BGC has 23%
- Curves and Flys are the next most important
- In Curves, ICAP has 34% and Tradition 30%
- In Butterfly, Tradition has 57% and Tullet 12%
- Forwards/IMMs and CCPSwitch are smaller types
- An Overall Share is subject to many asumptions
- See below for all the charts and details
Types of SOFR Swaps
SOFR Swaps in the IDB (inter-dealer broker) market trade primarily as Spreadovers to US Treasuries. This is by far the most frequent trade type for IDBs, with the highest volume in notional or dv01 terms and the most important in setting prices of SOFR Swaps.
Next are Curve/Switch trades, which are relative value trades, taking a position on the spread between standard tenors (e.g. 5Y10Y) to narrow or widen. These trades do not have direct impact on swap prices, but they do have second order impacts on the price levels of SOFR Swaps, so for example if someone is paying massively in 5Y and receiving in 10Y, this could change the relative spread by adjusting either the 5Y or 10Y Swap price.
Butterfly trades are similarily used for relative value between tenors e.g. 2Y5Y10Y, trade in large size and have second order impacts on price levels.
As well as these three main types, there are also:
- CCPSwitch trades, which move risk from one CCP to another, either CME to LCH and influence the basis spreads betwen Swaps cleared at the two clearing houses
- Outrights, which are the most common Dealer-to-Client (D2C) trade, but do not really trade in the IDB space for USD
- IMM Forwards, with dates that match CME SOFR Futures, for relative value or invoice spread trading
Let’s look at these in turn, focusing on the market share of each IDB/D2D platform venue.
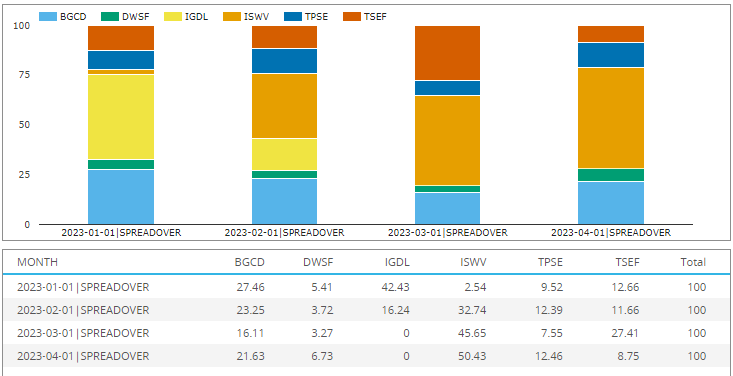
SOFR Spreadovers
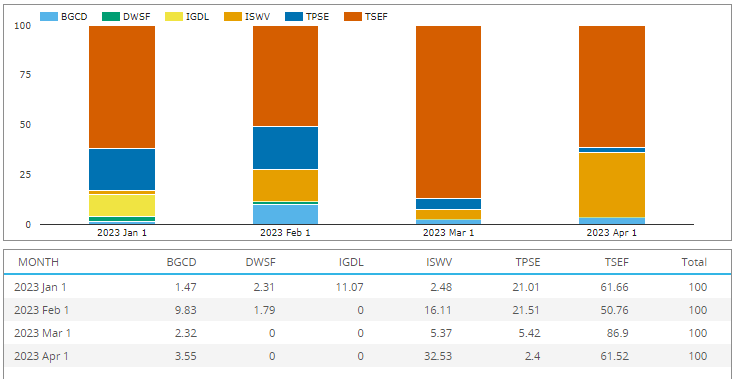
Starting with Spreadover trade counts by month and plaform identifier, for the year to 30-Apr-2023.
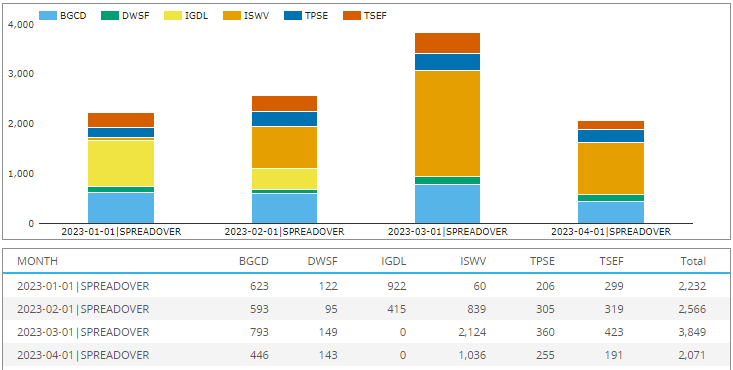
- March 2023 with a high of 3,849 trades, remaining months with 2,000 to 2,500 trades
- (Note ICAP trades are reported with platform id (MIC code) of either IGDL or ISWV in Jan and Feb, after which they use ISWV).
- ICAP has by far the largest share with 50% over the whole period and a high of 55% in March.
- BGC is next with 23% over the period and a high of 28% in January.
- Tradition (TSEF) next with 11.5% over the period
- Tullet (TPSE) with 10.5%
- Dealerweb (DWSF) with 5%
- All in trade count terms
(Note the Jan/Feb counts for ICAP are likely a touch understated as in much of this period ICAP was not marking spreadovers as packages, meaning we had to rely on an identification algorithm that most likely indentified a lower percentage of ICAp spreadovers compared to other platforms).
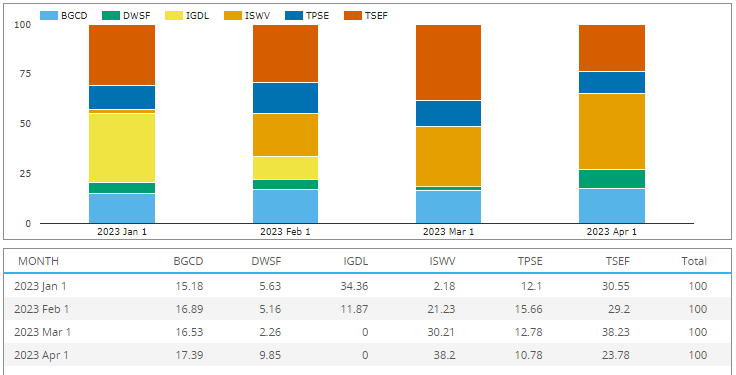
In SDRView, we can also use DV01, a risk measure that equalises risk by tenor and is a better proxy for market share of customer wallet for IDBs.
- ICAP with a high of 50.4% in April and an overall share of 47%
- BGC with 21% share for the period
- Tradition with 17.8%, materially higher than the 11.5% in trade count terms, primarly due to a much higher share of 27.4% in March from larger notional/dv01 trades
- Tullet with 10% for the period
- Dealerweb with 4.4% for the period
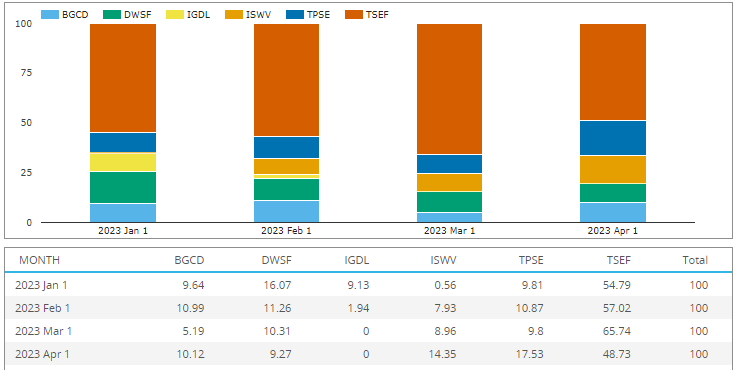
SOFR Curve/Switch trades
In SDRView, we can further identify trades into packages types, so lets do so for Curve (aka Switch) trades and aggregate both Spreadover Curves and Outright Curves.
Lets show this data as a percentage of the package adjusted dv01 measure (rather than summing the dv01 of each leg, we use an average of the two legs), a good proxy for market share of customer wallet.
- ICAP with 34.5% for the period and a high of 38% in April
- Tradition with 30.4% for the period and a high of 38% in March
- BGC with 16.5% share for the period
- Tullet with 12.8%
- Dealerweb with 5.7%
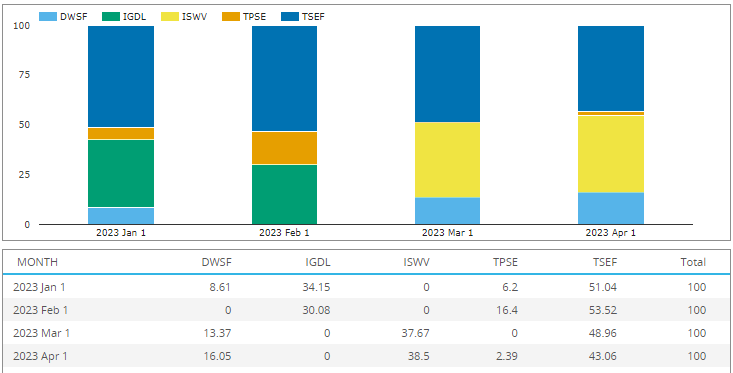
SOFR Butterfly trades
Next using SDRView, let’s identify trades that are are of package type Butterfly, either on Spreadover or Ouright legs and show this data as a percentage of the package adjusted dv01 measure (rather than summing the dv01 of each leg, we use half the belly), a good proxy for market share of customer wallet.
- Tradition with 56.6% for the period and a high of 65.7% in March
- Tullet with 12% for the period and a high of 17.5% in April
- Dealerweb with 11.7% for the period
- ICAP with 10.7%
- BGC with 9%
SOFR CCPSwitch Trades
Next CCPSwitch trades, which with 126 trades in our 4-month period are far less than the 2,000 to 3,800 per month Spreadover trades, nevertheless are important in setting the basis price between CME and LCH cleared Swaps. Again we use percentage share in dv01 terms.
- Tradition with 49% share over the period
- ICAP with 35%
- Dealerweb with 9.5%
- Tullet with 6%
- BGC with no volume (or our algorithm has not been able to find any of their trades)
SOFR Forwards/IMM Trades
Next Forwards and IMM trades, which average 100 trades a month on the D2D platform venues.
- Tradition with 65% share over the period
- ICAP with 17%
- Tullet with 12.6%
- BGC with 4.3%
- Dealerweb with 1%
Combined Share?
We could look to create an overall share for all SOFR Swaps at IDBs, however this gets tricky with assumptions that can skew the numbers one way or another.
- Do we use trade count or dv01?
- How do we adjust for packages?
- Spreadovers are far more important in setting prices, while Curves and Flys as relative value trades transact in larger size which overstates their importance particularily as they have a second order impact on price.
- The same argument can be made for CCPSwitch.
- So should we weight the volumes of each type in some way to compensate?
- Share of wallet is further complicated by differences in brokerage calculations between platforms
- Not forgeting that large trades have capped notionals in SDRs, which may understate share in specific months for a platform relative to others
Still with many caveats, if I had to come up with a number it would be something like ICAP 40%, Tradition just above BGC, both in the low 20% range, Tullet 10-12%, Dealerweb 5%.
Again, depending on the asumptions above, these percentage can be skewed up and down.
Consequently I much prefer market share for each package type (Spreadovers, Curve, Flys) as I have shown in the charts and tables in prior sections.
Thats’ It
Six charts to cover market share for IDBs.
There is a lot more data in SDRView and SEFView.
Daily, weekly, monthly, quarterly, annual.
Currency, Product, Subtype and Package type.
Trade counts, notionals, dv01.
Venue type (D2D, D2C, SDP, Off Venue).
Please contact us if you are interested in a subscription.
- SEO Powered Content & PR Distribution. Get Amplified Today.
- PlatoAiStream. Web3 Data Intelligence. Knowledge Amplified. Access Here.
- Minting the Future w Adryenn Ashley. Access Here.
- Buy and Sell Shares in PRE-IPO Companies with PREIPO®. Access Here.
- Source: https://www.clarusft.com/idb-market-share-in-sofr-swaps/?utm_source=rss&utm_medium=rss&utm_campaign=idb-market-share-in-sofr-swaps
- :has
- :is
- :not
- $UP
- 000
- 1
- 10
- 100
- 11
- 12
- 2023
- 27
- 30
- 50
- 500
- 9
- a
- Able
- above
- Adjusted
- After
- again
- algorithm
- All
- also
- an
- and
- annual
- Another
- any
- April
- ARE
- argument
- AS
- At
- average
- basis
- BE
- been
- below
- Better
- between
- both
- broker
- brokerage
- but
- by
- CAN
- ccp
- change
- Charts
- Clearing
- CME
- code
- come
- Common
- compared
- complicated
- could
- cover
- create
- curve
- customer
- D2C
- data
- Dates
- Depending
- details
- determined
- differences
- direct
- do
- down
- due
- dv01
- e
- each
- either
- example
- far
- Feb
- Find
- focusing
- For
- Free
- frequent
- from
- further
- Futures
- good
- had
- Half
- Have
- High
- higher
- highest
- However
- HTTPS
- i
- ID
- Identification
- identifier
- identify
- if
- Impact
- Impacts
- importance
- important
- in
- influence
- informed
- interested
- into
- IT
- Jan
- January
- just
- large
- larger
- largest
- legs
- less
- Lets
- levels
- like
- likely
- Look
- Lot
- Low
- made
- Main
- mainly
- many
- March
- Market
- marking
- massively
- Match
- materially
- max-width
- May..
- meaning
- measure
- Month
- monthly
- months
- more
- most
- move
- much
- Nevertheless
- Newsletter
- next
- no
- Notional
- number
- numbers
- of
- off
- on
- ONE
- or
- order
- Other
- our
- over
- overall
- package
- packages
- paying
- percentage
- period
- platform
- Platforms
- plato
- Plato Data Intelligence
- PlatoData
- position
- prefer
- price
- Prices
- primarily
- Prior
- Product
- proxy
- range
- rather
- really
- receiving
- rely
- remaining
- Reported
- Risk
- same
- SDP
- Second
- sections
- setting
- Setting prices
- Share
- should
- show
- shown
- Size
- skew
- smaller
- So
- some
- Someone
- something
- Space
- specific
- spread
- Spreads
- standard
- subject
- subscribe
- subscription
- swap
- SWAP Price
- Swaps
- Switch
- taking
- terms
- than
- that
- The
- their
- There.
- These
- they
- this
- three
- to
- touch
- trade
- trades
- tradition
- transact
- Treasuries
- TURN
- two
- type
- types
- URL
- us
- us treasuries
- use
- used
- using
- value
- Venue
- venues
- volume
- volumes
- Wallet
- was
- Way..
- we
- weekly
- weight
- WELL
- which
- while
- whole
- with
- would
- year
- you
- zephyrnet