EOS price has propelled by 10% and now is one of the top gainers over the 24 hours. This has pushed the coin quite close to its next price resistance. The bulls were back on the 24 hour chart and that depicted positive price action for the coin.
Despite Bitcoin falling on the chart and other major altcoins moving south EOS noted a considerable surge in price. EOS price also depicts a broad wedge pattern, this pattern is often tied to exhaustion of a trend. In this case, EOS price was reversing its previous bearish price momentum.
Technical outlook on the chart pointed towards bullish price action gaining strength. Buying strength on the 24 hour chart were substantially high.
In case buying strength holds its ground, a move to the immediate resistance becomes easy for the altcoin. Price of EOS needs to trade above its current price action for the coin to move and witness another possible rally.
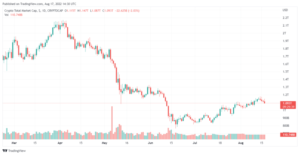
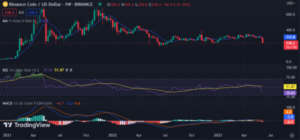
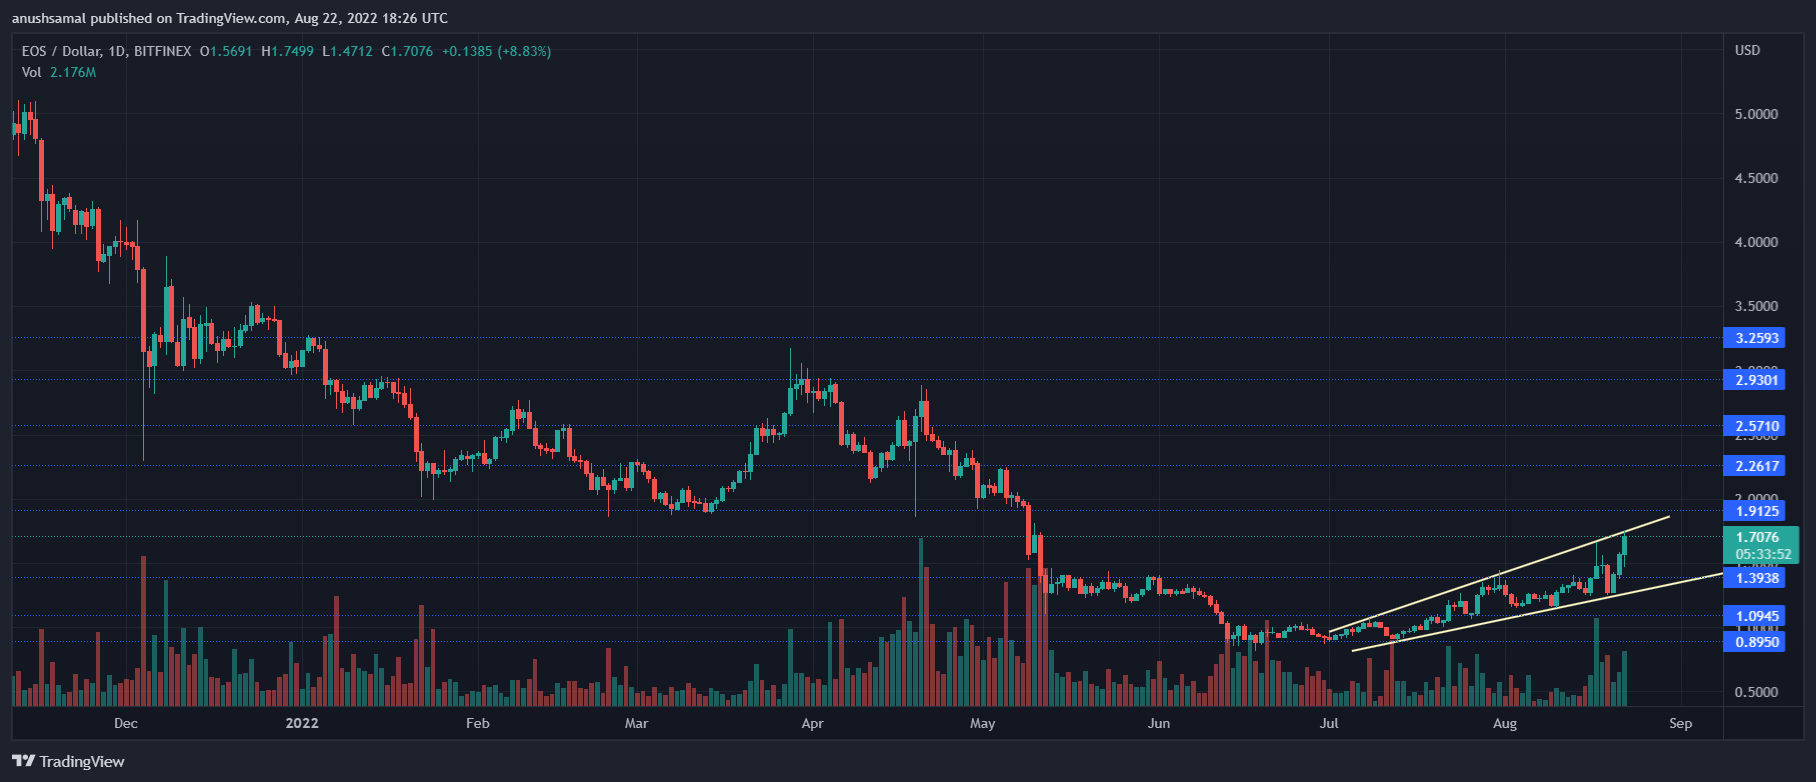
EOS Price Analysis: One Day Chart
The altcoin was trading at $1.70 at the time of writing. It secured double digit gains over the last 24 hours as the bulls surfaced. The coin has also formed a broad wedge pattern which meant that EOS’s previous bearish price thesis would be discontinued.
The overhead resistance for the coin stood at $1.90 and a move above that level will push EOS to $2. In case the sellers resurface in the market, the local support level for the coin awaited at $0.90. The amount of EOS traded over the last trading session increased as depicted by the green bar indicating that buying strength also mounted.
Technical Analysis

The bullish momentum flashed increase in demand for the coin. The technical indicator also reflected the increase in buying strength. The Relative Strength Index was positive as it was seen above the half-line denoting that EOS price was bullish.
RSI was hovering near the oversold zone and with an increase in demand, the coin would be overbought. Price of the altcoin was above the 20-SMA line which meant that buyers were driving the price momentum in the market. EOS was also above the 50-SMA which was a sign of bullishness.
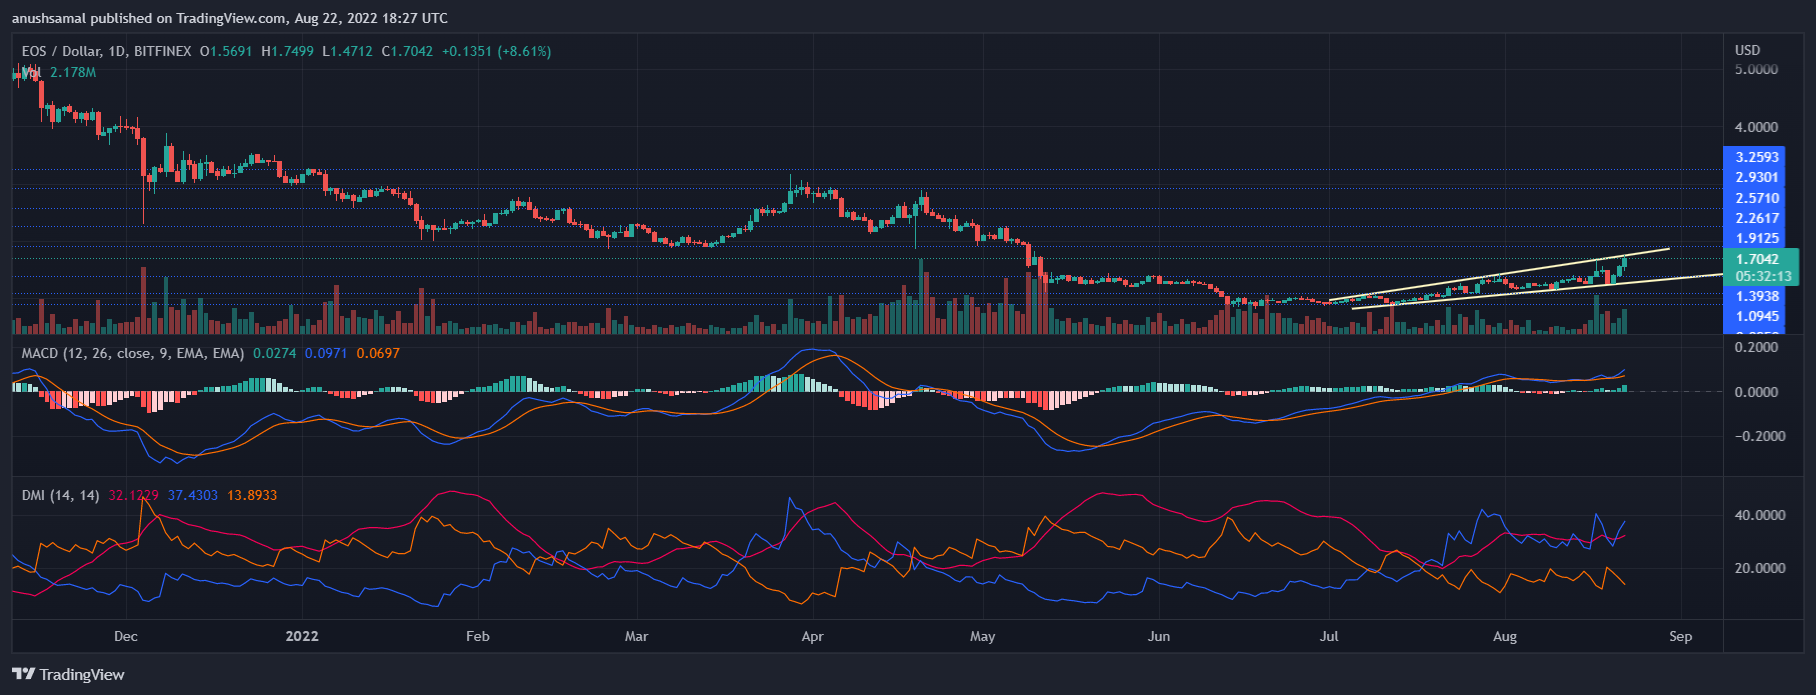
Increase in price and demand made EOS display buy signal on its technical indicator. Moving Average Convergence Divergence indicate the price momentum and reversal in the same. MACD underwent the bullish crossover and displayed green histograms which were essentially buy signal for the coin.
Directional Movement Index portray the price direction. DMI was positive as +DI was above the -DI line. Average Directional Index (red) was nearing the 40-mark, this indicated that the current price momentum was gaining strength. This also could be a sign of continued bullishness over the immediate trading sessions.
- Bitcoin
- blockchain
- blockchain compliance
- blockchain conference
- coinbase
- coingenius
- Consensus
- crypto conference
- crypto mining
- cryptocurrency
- Cryptocurrency News
- decentralized
- DeFi
- Digital Assets
- EOS
- eosusd
- eosusdt
- ethereum
- machine learning
- NewsBTC
- non fungible token
- plato
- plato ai
- Plato Data Intelligence
- Platoblockchain
- PlatoData
- platogaming
- Polygon
- proof of stake
- W3
- zephyrnet