One of our readers pointed me to yesterday’s Bloomberg article, “A Single Bet on Deutsche Bank’s Credit Default Swaps is Seen Behind Fridays Rout“, which makes the bold claim that a single CDS trade fuelled a global sell-off on Friday. So in today’s article I will take a look at what the data shows.
SEC SBSDRs
Under SEC regulations, Securities Based Swap Data Repositorys (SBSDRs), operated by DTCC and ICE, publicly disseminate OTC Credit Derivative trades on single-names traded by US persons. As US persons repreent the majority of trading activity in the market, we can use this data to get an insight into volumes and prices.
Clarus SBSDRView makes it simple to query and analyse this data.
Deutsche Bank CDS Trades
A quick instrument search allows me to find the name I am interested in.
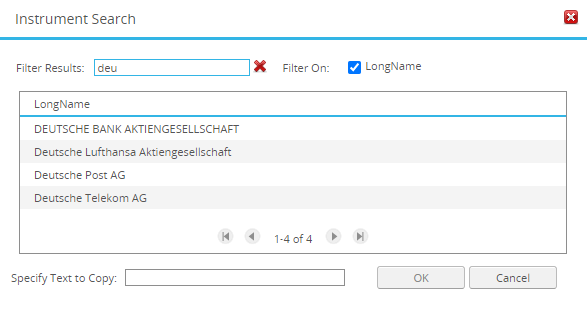
And then search for trades in a date range, product and currency.
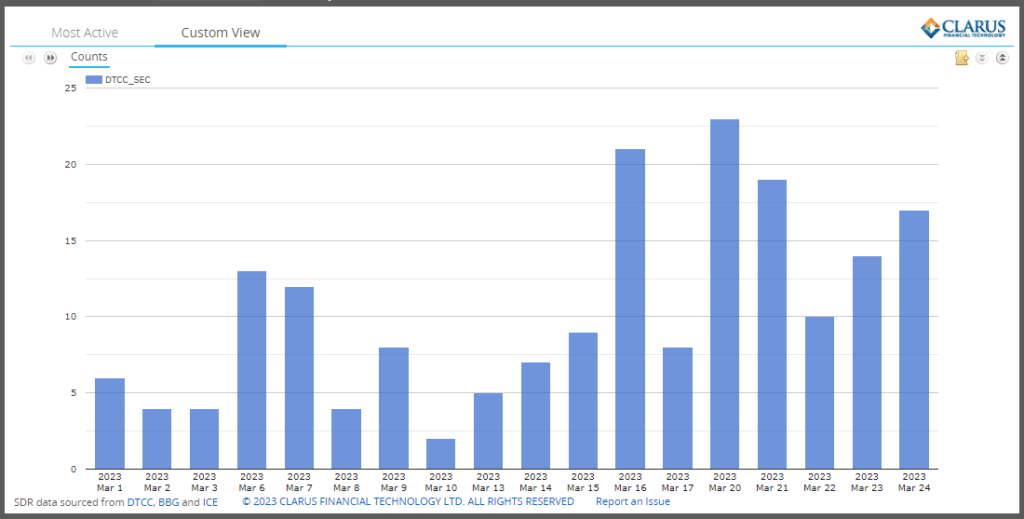
Showing:
- Less than 10 trades a day up to 15th March
- A jump to 21 trades on 16th March
- Down to 8 trades on 17th March
- A jump to a high of 23 trades on 20th March
- (Recall Sunday 19th March was when Credit Suisse was taken over by UBS)
- Daily volumes remaining above 10 trades for the rest of the week
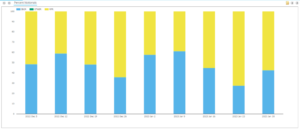
SEC public dissemination rules are consistent with FINRA TRACE for US Corporate Bonds, so trade sizes are only disclosed up to $5million gross notional (or equivalent in EUR of 4.6million). Let’s chart the split between capped and standard.
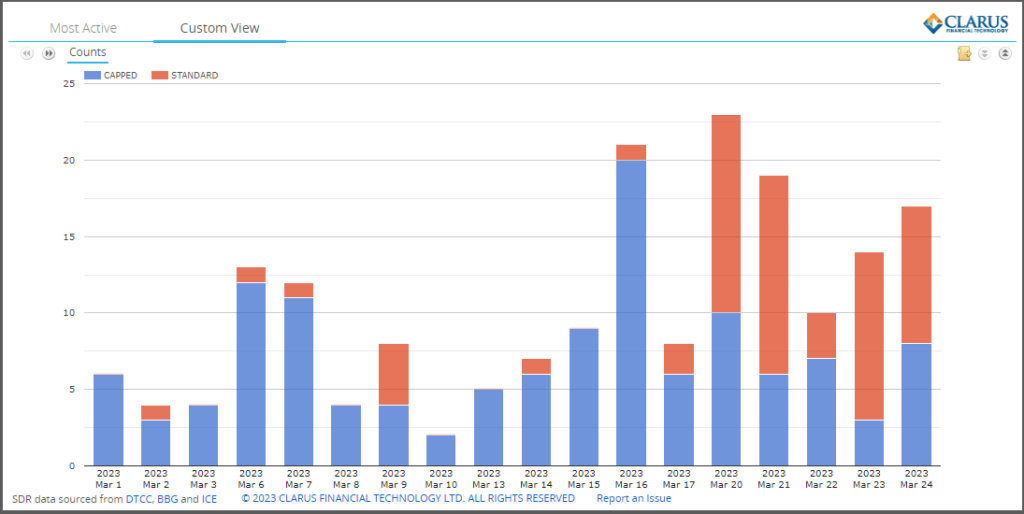
Showing Capped trade counts for trades above $5million and Standard as below $5million.
What stands out is the big jump in standard (smaller) trades from 20th March onwards, meaning interest and activity in trading this name.
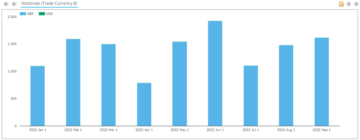
Let’s now look at the data in gross notional terms.
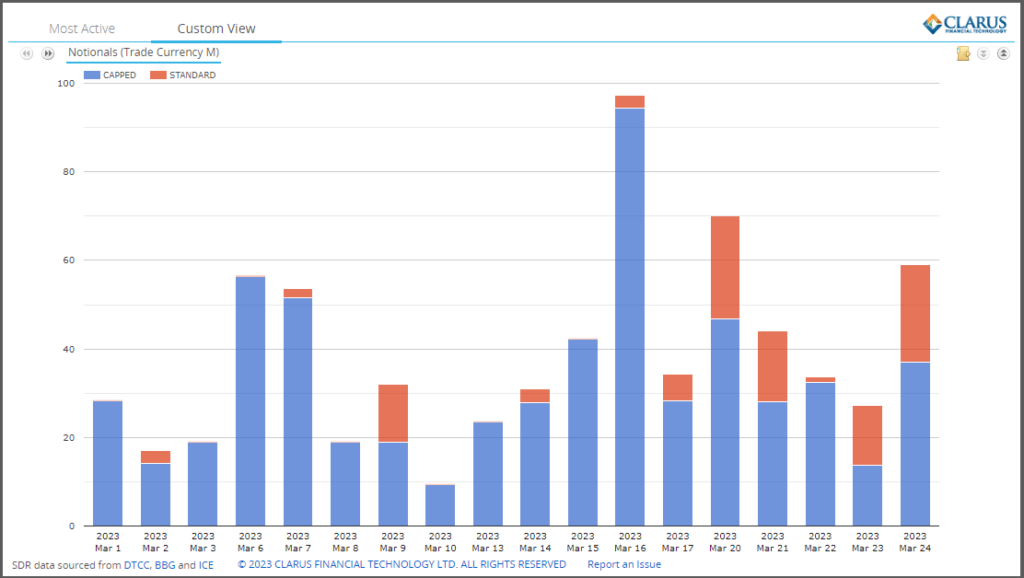
Showing the even more pronunced jump on 16th March, with at least €100 million of gross notional and given that only €3million is from 1 standard trade and €94 million from 20 capped trades, the volume on this day would have been significantly higher as market particpants sought to buy or sell protection on Deutsche Bank.
Friday 24th March, the day highlighted in the Bloomberg article, in contrast has 9 standard trades totalling €22 million and 8 capped trades of €37 million.
Price Information
Publicly disseminated information on these CDS trades, includes the common fields we have come to expect in US transparency e.g. execution time, product identifier, underlying asset id, maturity date, notional and price.
Unfortunately as Chris pointed out in his recent Credit Suisse & UBS Live Blog, the price information published is lacking.
For the 17 trades executed on 24th March, we see:
- All have a coupon of 1%
- 14 are 5Y (Jun-28), 2 are 2Y (Dec-24) and 1 is 18m (Jun-24)
- 11 have a cash amount in the Other Payment Amount field
- 6 have nothing in this field and no spread price either
In theory, I should be able to take the cash amount and convert to a running or upfront Credit Spread using the ISDA CDS Standard Model.
Unfortunately looking at the data, there are a lot of open questions, e.g. is the cash amount adjusted to the capped notional threshold of €4.6 million or not? A quick look shows a few standard 5Y trades with the cash amount as 0.17 of notional but the capped ones have much lower ratios of 0.05, 0.09 or 0.1, suggesting that the cash payment is not adjusted down for the disclosed notional.
Given more time, it may be possible to make sense of the price information, unfortunately I don’t have time before my publication deadline today. But why it is not correct and useful in the public data in the first place, is annoying.
The Single Bet
To isolate a trade that could have caused an abrupt move in the pricing of CDS Spreads on Deutsche Bank and knock-on effects on other markets, we would expect to see one or more large notional trades at prices much wider than other trades that day or prior days.
Given the capped notional rules of €4.6 million, we have 8 candidate trades that could be signficiantly larger than this notional, as it is unlikely that single trade close to this size would fuel a sell-off. For instance we have seen similar and high volumes on prior days, in particular 16th March.
To boot the lack of clean price information, means we cannot categorically spot a trade at a wider spread than others that day.
The mystery remains on which trade and did it really fuel a sell-off.
In times of uncertainity, there is a greater fear that someone knows more than you, which can fuel a tendency to overreact to reports of large trades. We cannot say if that happened in this case, one for journalists to corroborate with traders.
I would echo the sentiments of the Bloomberg article in that we need better transparency in single name CDS.
The SEC SBSDRs are very close in providing this with near real-time dissemination of key information on executed trades.
We just need a few improvements in data quality to get there.
- SEO Powered Content & PR Distribution. Get Amplified Today.
- Platoblockchain. Web3 Metaverse Intelligence. Knowledge Amplified. Access Here.
- Source: https://www.clarusft.com/deutsche-bank-credit-default-swaps/?utm_source=rss&utm_medium=rss&utm_campaign=deutsche-bank-credit-default-swaps
- :is
- $UP
- 1
- 10
- 8
- 9
- a
- Able
- above
- activity
- Adjusted
- allows
- amount
- analyse
- and
- ARE
- article
- AS
- asset
- At
- Bank
- based
- BE
- before
- behind
- below
- Bet
- Better
- between
- Big
- Bloomberg
- bold
- Bonds
- buy
- by
- CAN
- candidate
- cannot
- case
- Cash
- caused
- CDS
- Chart
- Chris
- claim
- Close
- come
- Common
- consistent
- contrast
- convert
- Corporate
- corroborate
- could
- coupon
- credit
- credit default
- credit default swaps
- credit suisse
- Currency
- data
- data quality
- Date
- day
- Days
- Default
- Deutsche Bank
- DID
- Dont
- down
- DTCC
- e
- echo
- effects
- Equivalent
- Ether (ETH)
- EUR
- Even
- execution
- expect
- fear
- few
- field
- Fields
- Find
- First
- For
- Free
- Friday
- Fridays
- from
- Fuel
- get
- given
- Global
- greater
- gross
- happened
- Have
- High
- higher
- Highlighted
- HTTPS
- i
- ICE
- ID
- identifier
- improvements
- in
- includes
- information
- informed
- insight
- instance
- instrument
- interest
- interested
- IT
- Journalists
- jump
- Key
- Lack
- large
- larger
- live
- Look
- looking
- Lot
- Majority
- make
- MAKES
- March
- Market
- Markets
- maturity
- meaning
- means
- million
- more
- move
- Mystery
- name
- Near
- Need
- Newsletter
- Notional
- of
- on
- ONE
- open
- operated
- OTC
- Other
- Others
- particular
- payment
- persons
- Place
- plato
- Plato Data Intelligence
- PlatoData
- possible
- price
- Prices
- pricing
- Prior
- Product
- protection
- providing
- public
- Publication
- publicly
- published
- quality
- Questions
- Quick
- range
- readers
- real-time
- recent
- regulations
- remaining
- remains
- Reports
- REST
- rules
- running
- Search
- SEC
- Securities
- sell
- sell-off
- sense
- should
- Shows
- significantly
- similar
- Simple
- single
- Size
- sizes
- smaller
- So
- Someone
- split
- Spot
- spread
- Spreads
- standard
- stands
- subscribe
- Suisse
- Swaps
- Take
- terms
- that
- The
- These
- threshold
- time
- times
- to
- today
- today’s
- trace
- trade
- traded
- Traders
- trades
- Trading
- Transparency
- ubs
- underlying
- URL
- us
- use
- volume
- volumes
- What
- which
- wider
- will
- with
- would
- zephyrnet