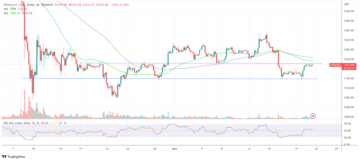
Bitcoin price is correcting gains below the $24,000 zone. BTC is holding the $23,250 support and might attempt another increase in the near term.
- Bitcoin is correcting gains from the $24,250 resistance zone.
- The price is trading above $23,250 and the 100 hourly simple moving average.
- There is a major bullish trend line forming with support near $23,300 on the hourly chart of the BTC/USD pair (data feed from Kraken).
- The pair could start a fresh increase if it stays above the $23,250 support zone.
Bitcoin Price Remains Supported
Bitcoin price attempted an upside break above the $24,000 resistance zone. BTC spiked above the $24,250 level, but there was no upside continuation. A high was formed near $24,282 before there was a downside correction.
The price declined below the $24,000 level. There was a move below the 50% Fib retracement level of the upward wave from the $22,752 swing low to $24,282 high. However, the bulls seems to be active above the $23,250 support zone.
Bitcoin price is still trading above $23,250 and the 100 hourly simple moving average. There is also a major bullish trend line forming with support near $23,300 on the hourly chart of the BTC/USD pair. The trend line is near the 61.8% Fib retracement level of the upward wave from the $22,752 swing low to $24,282 high.
An immediate resistance is near the $23,950 level. The next major resistance is near the $24,250 zone. A clear move above the $24,250 resistance might start a decent increase.

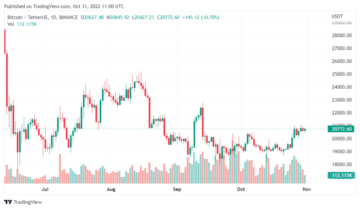
Source: BTCUSD on TradingView.com
In the stated case, the price may perhaps rise towards the $25,000 level. The next resistance could be near the $25,500 level, above which btc price might test $26,200.
Downside Break in BTC?
If bitcoin price fails to clear the $23,950 resistance, it could continue to move down. An immediate support on the downside is near the $23,400 zone.
The next major support is near the $23,250 zone or the 100 hourly simple moving average. A downside break below the $23,250 level might send the price towards the $22,650 level. Any more losses might send the price to $22,500 in the near term.
Technical indicators:
Hourly MACD – The MACD is now gaining pace in the bearish zone.
Hourly RSI (Relative Strength Index) – The RSI for BTC/USD is now below the 50 level.
Major Support Levels – $23,400, followed by $23,250.
Major Resistance Levels – $23,950, $24,250 and $25,000.
- SEO Powered Content & PR Distribution. Get Amplified Today.
- Platoblockchain. Web3 Metaverse Intelligence. Knowledge Amplified. Access Here.
- Source: https://www.newsbtc.com/analysis/btc/bitcoin-price-technical-correction-23-2k/
- 000
- 100
- a
- above
- active
- and
- Another
- average
- bearish
- before
- below
- Bitcoin
- Bitcoin Price
- Break
- BTC
- btc price
- BTC/USD
- Bullish
- Bulls
- case
- Chart
- clear
- continuation
- continue
- could
- data
- down
- downside
- fails
- followed
- formed
- fresh
- fresh increase
- from
- gaining
- Gains
- High
- holding
- However
- HTTPS
- immediate
- in
- Increase
- index
- Indicators
- IT
- Key
- Kraken
- Level
- levels
- Line
- losses
- Low
- MACD
- major
- max-width
- might
- more
- move
- moving
- moving average
- Near
- NewsBTC
- next
- Pace
- perhaps
- plato
- Plato Data Intelligence
- PlatoData
- price
- relative strength index
- remains
- Resistance
- retracement
- Rise
- rsi
- seems
- Simple
- SMA
- start
- stated
- Still
- strength
- strong
- support
- support levels
- Technical
- technical correction
- test
- The
- to
- towards
- Trading
- TradingView
- Trend
- Upside
- upward
- Wave
- which
- zephyrnet