The Taker Buy/Sell Ratio shows that the recent rebound from $33K to $43K has created some positive momentum in the market. On the other side, technical analysis is signaling a correction in the short term. Amid market ambiguity, the best bet is usually to wait it out and see what side prevails as volatility is expected.
Technical Analysis
By: Edris
Long-Term
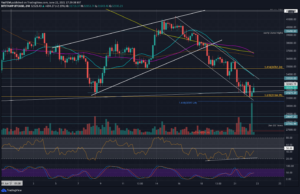
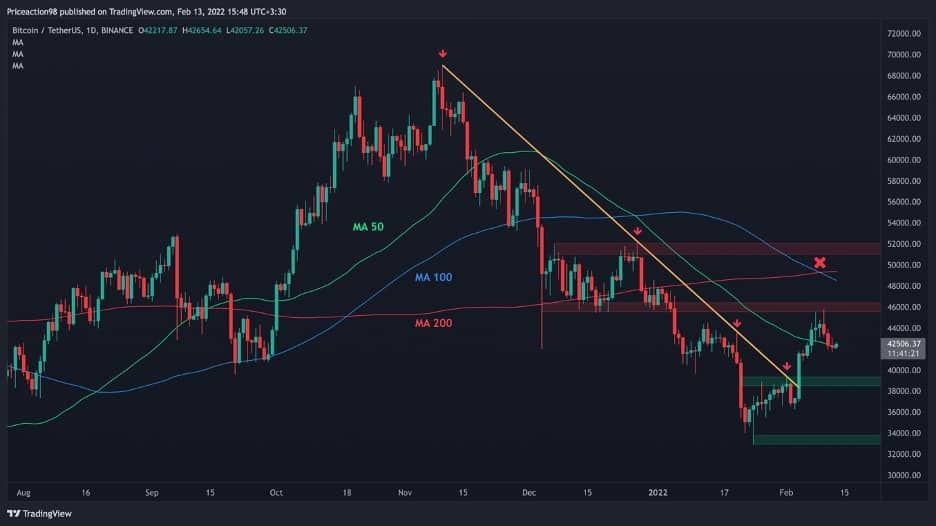
Bitcoin is still recovering from the 50% crash from its all-time high ( $69K) in November 2021. Recently, the price has rebounded from the $33K level, breaking a major bearish trendline and crossing the psychological resistance at $40K.
This positive momentum continued and the price soared above the 50-day moving average. However, the bullish wave has come to a halt, as a bearish cross took place between the 100 and 200-day moving averages, and also, the $46k static resistance has rejected the price. Currently, the 50-day moving average is acting as a support, pushing BTC towards the resistance area once again. Therefore, a pullback to the $39k area seems possible if bulls fail here.
Short-Term
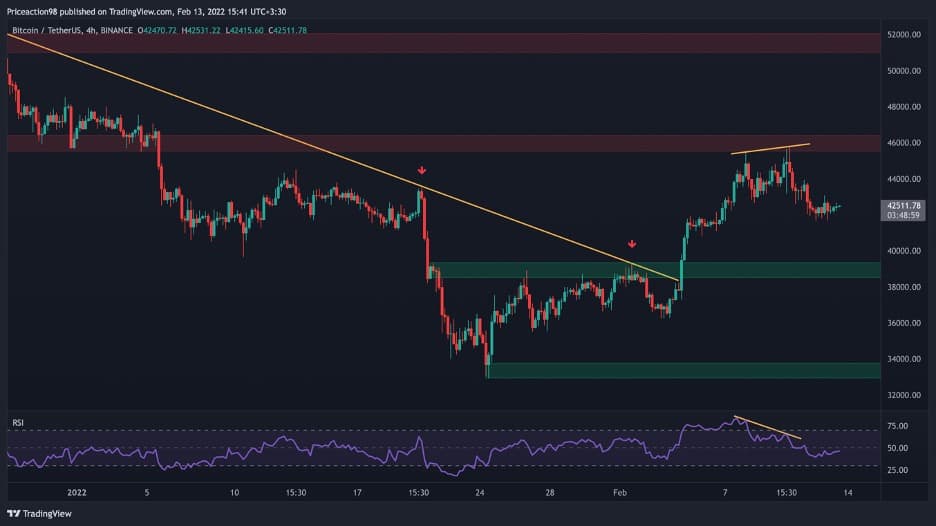
Looking at the 4-hour time frame, it is evident that a massive RSI bearish divergence formed while the price was testing the $46K area in two failed incidents, indicating the lack of bullish momentum. The RSI has also broken below the 50% mark, showing that the bears are in control and a deeper retracement towards the $39k area is feasible.
Onchain Analysis
By: Shayan
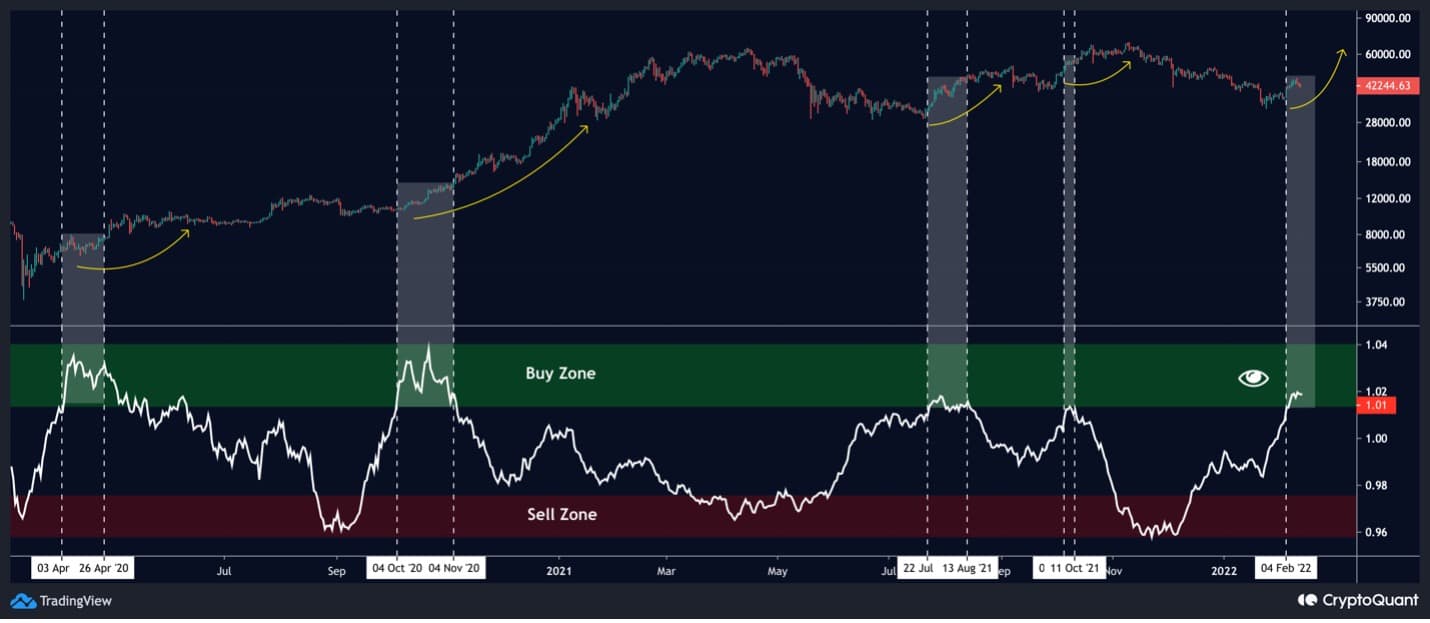
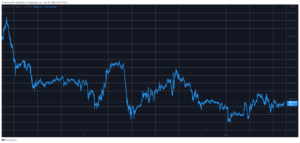
The Taker Buy/Sell Ratio is the proportional balance between buy/sell sentiment in the perpetual futures market. The buying sentiment is stronger when the value is greater than 1, while the selling sentiment is higher when the value is less than 1.
Historically, when the metric reaches the green zone, it suggests more buying pressure and that it is an excellent time to purchase BTC. In contrast, when it comes to the red area, it shows that there is more selling pressure and that the price is likely to begin a correction phase. Right now, the metric has reached the green zone. Hence, there is a high possibility for this rally to go further in the mid-term while the market might see some corrections on its way up.
- 100
- 2021
- Ambiguity
- analysis
- AREA
- average
- bearish
- Bears
- BEST
- Bitcoin
- Bitcoin Price
- Bitcoin Price Analysis
- BTC
- Bullish
- Bulls
- Buying
- control
- Corrections
- Crash
- deeper
- expected
- Futures
- Green
- here
- High
- HTTPS
- IT
- Level
- major
- mark
- Market
- Momentum
- Other
- phase
- possibility
- possible
- pressure
- price
- Price Analysis
- purchase
- rally
- sentiment
- Short
- support
- Technical
- Technical Analysis
- Testing
- time
- usually
- value
- Volatility
- wait
- Wave
- What