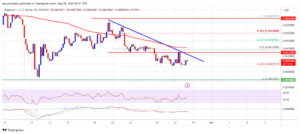
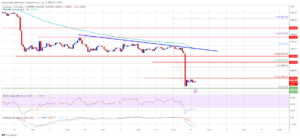
Bitcoin price is at local resistance, brushing up against the death cross of the 50 and 200-day moving average, and is exhibiting other potentially bearish signals.
However, bears should beware that while price has yet to do anything dramatic, the underlying trend strength is now at late 2020 levels — the same levels that resulted in an explosive rally to new all-time highs.
Why So Bearish On Bitcoin?
The macroeconomic landscape is teetering on the edge of a recession and for the last year and then some, it has market sentiment overwhelmingly bearish. During that time, Bitcoin fell to $15,000 and altcoins saw a 90%+ drawdown. The stock market even dipped below the key 20% bear market level.
Little has improved aside from inflation cooling slightly and the Fed barely backing off the larger rate hikes that dominated 2022. Things have even worsened for Bitcoin, which confirmed the first weekly death cross in its history. Because of these factors, the recent Bitcoin rally has been widely shrugged off as a bear market rally and another opportunity to go short.
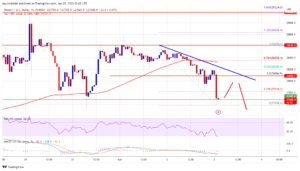
However, bears should be weary about shorting Bitcoin at this level, according to the Average Directional Index. The tool is showing a reading stronger than at any point during 2022, and is at the highest level since late 2020 and early 2021.
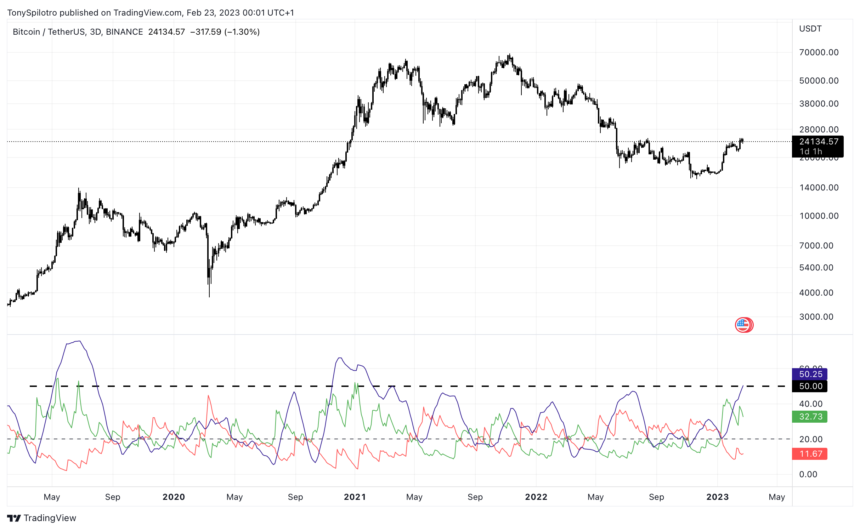
The trend is strengthening according to the ADX | BTCUSD on TradingView.com
Trend Strength Reaches Historically Bullish Levels
The Average Directional Index is a trend strength measuring tool, developed by J. Welles Wilder Jr. — the creator of other popular technical indicators such as the Relative Strength Index, the Parabolic SAR, and the Average True Range.
The ADX is used by itself or with a Directional Movement Index consisting of a DI- (red) and a DI+ (green) which indicate if bears or bulls are in control. When the ADX climbs above a reading of 20, it suggests a trend is beginning and strengthens the higher the reading. Trends begin to weaken after the ADX peaks. Falling below a reading of 20 shows a distinct lack of a trend.
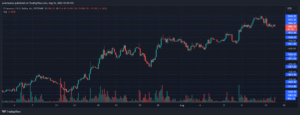
The BTCUSD 3-day ADX reading is currently above 50 — the highest level since 2020. From the time the ADX pushed above 50 and the price rally peaked, Bitcoin climbed by 300%. Another 300% climb from current levels would take the top crypto to $72,000 and a new all-time high.
The reading is also higher than at any point during the recent 2022 downtrend. Prior to the late 2020 and early 2021 rally mentioned above, the previous time BTCUSD 3-day ADX readings reached such a level was during the 2019 bull impulse. From that reading of 50 to the rally peak, price climbed another 170%. The same percentage rally would take Bitcoin to above $40,000 per coin.
There is no telling if the underlying trend will continue strengthen or this is it. But history suggests that shorting Bitcoin when the trend is this strong, hasn’t been the most rewarding strategy.
The #Bitcoin 3D Average Directional Index is showing the strongest trend since late 2020, just prior to reaching new ATHs. Above this level, things should get interesting very quickly. pic.twitter.com/0lFfHu1Mm1
— Tony "The Bull" (@tonythebullBTC) February 22, 2023
- SEO Powered Content & PR Distribution. Get Amplified Today.
- Platoblockchain. Web3 Metaverse Intelligence. Knowledge Amplified. Access Here.
- Source: https://www.newsbtc.com/analysis/btc/bears-beware-bitcoin-trend/
- 000
- 2020
- 2021
- 2022
- 3d
- 9
- a
- About
- above
- According
- advice
- adx
- After
- against
- all-time highs
- Altcoins
- analysis
- and
- Another
- average
- average directional index
- backing
- Bear
- Bear Market
- bearish
- Bears
- because
- Beginning
- below
- Beware
- Bitcoin
- Bitcoin Rally
- BTCUSD
- bull
- Bullish
- Bulls
- Charts
- climb
- Climbed
- Coin
- CONFIRMED
- considered
- Consisting
- content
- continue
- control
- creator
- Cross
- crypto
- Current
- Currently
- daily
- Death
- developed
- distinct
- dramatic
- during
- Early
- Edge
- Education
- educational
- Even
- Exclusive
- factors
- Falling
- featured
- Fed
- First
- from
- get
- Go
- Green
- High
- higher
- highest
- Highs
- Hikes
- historically
- history
- HTTPS
- image
- improved
- in
- index
- indicate
- Indicators
- inflation
- insights
- interesting
- investment
- IT
- itself
- Key
- Lack
- landscape
- larger
- Last
- Last Year
- Late
- Level
- levels
- local
- Macroeconomic
- Market
- market sentiment
- max-width
- measuring
- mentioned
- most
- movement
- moving
- moving average
- New
- NewsBTC
- Opportunity
- Other
- parabolic
- Peak
- percentage
- plato
- Plato Data Intelligence
- PlatoData
- please
- Point
- Popular
- potentially
- previous
- price
- price rally
- Prior
- pushed
- quickly
- rally
- range
- Rate
- rate hikes
- reached
- Reaches
- reaching
- Reading
- recent
- recession
- Red
- Resistance
- rewarding
- same
- sentiment
- Short
- Shorting
- shorting bitcoin
- should
- Shows
- signals
- since
- So
- some
- stock
- stock market
- Strategy
- strength
- Strengthen
- strengthening
- Strengthens
- strong
- stronger
- such
- Suggests
- Take
- Technical
- Technical Analysis
- The
- the Fed
- things
- time
- to
- Tony
- tool
- top
- TradingView
- Trend
- Trends
- true
- underlying
- which
- while
- widely
- will
- would
- year
- zephyrnet