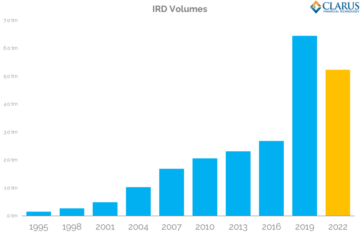
A review of Credit Derivatives (CRD) volumes and market share at Clearing Houses (CCPs) in 1Q 2023.
- Index, Single-name and Swaptions
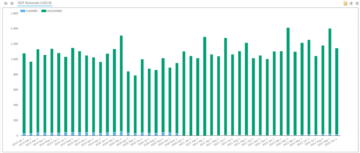
- Volumes in 1Q23 down 7% from a year earlier
- In USD, CDX volumes were down, while CDS were up
- In USD, ICE Clear Credit had 96% share in the quarter
- In EUR, iTraxx volumes were down, while CDS were up
- In EUR iTraxx, LCH CDSClear gained share from a year earlier
- In EUR CDS, ICE Clear Credit gained share
- Swaptions volume in both EUR & USD
All the charts and detail from CCPView.
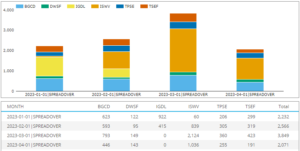
CRD by Currency
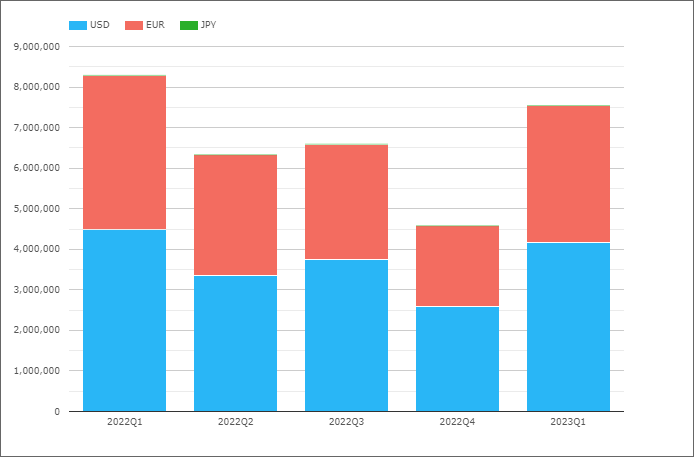
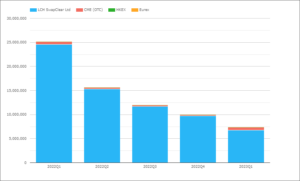
- USD CRD 2023Q1 volume of $4.16 trillion, is down 7.5% from $4.5 trillion in 2022Q1
- EUR CRD 2023Q1 volume of $3.4 trillion, is down 10% from $3.8 trillion in 2022Q1, while in EUR terms the decrease is 7%, similar to USD, with €3.16 trillion down from €3.39 trillion
- JPY CRD 2023Q1 volume of $3.6 billion, is up from $2.5 billion in 2022Q1
So 7% decreases in both USD and EUR from a year earlier.
USD CDX, CDS and Swaptions

- USD CDX 2023Q1 volume of $3.7 trillion, down from $4.15 trillion in 2022Q1
- USD CDS 2023Q1 volume of $369 billion, up from $324 billion in 2022Q1
- USD CDXSwaptions 2023Q1 volume of $23 billion, up from $8 billion
CDX volumes in 2023Q1 were 90% of USD volume, single-name CDS 9% and CDXSwaptions 1%.
USD CRD Index Series

- USD CDX.IG 2023Q1 volume of $2.76 trillion, down 11.5% from $3.12 trillion in 2022Q1
- USD CDX.HY 2023Q1 volume of $0.84 trillion, down 4.5% from $0.88 trillion in 2022Q1
- USD CDX.EM 2023Q1 volume of $97 billion, is similar to 2022Q1
- USD iTraxx.Asia 2023Q1 volume of $25.5 billion, down from $40 billion
- USD iTraxx.Australia 2023Q1 volume of $13.6 billion, down from $14.7 billion
CDX.IG volumes representing 74% of USD Index volumes.
USD CDS (single-name)

- CDS Single-name Sovereign volume of $184 billion, similar to $186 billion in 2022Q1
- CDS Single-name Corporate volume of $173 billion, up 34% from $129 billion in 2022Q1
- CDS Single-name CP Financials volume of $11.4 billion, up from $8.3 billion in 2022Q1
CDS Sovereign volume represents 50% of total USD CDS single-name volume in the quarter.
USD Market Share by CCP

- ICE Clear Credit with 96.1% in 2023Q1, down a touch from 97.5% in 2022Q1
- ICE Clear Europe with 2.5% in 2023Q1, up a touch from 2.1% in 2022Q1
- LCH CDSClear with 1.5% in 2023Q1, up from 0.4% in 2022Q1
ICE Clear Credit share in index is slightly lower than in single names and it is the only CCP with USD CDXSwaption volume.
EUR CRD Index, CDS and Swaptions

- EUR iTraxx 2023Q1 volume of €2.85 trillion, down 11.5% from €3.22 trillion in 2022Q1
- EUR CDS 2023Q1 volume of €302 billion, up 125% from €134 billion in 2022Q1
- EUR iTraxxSwaptions 2023Q1 volume of €98.6 billion, up 218% from €31 billion in 2022Q1
So while index volume is down, single-name massively up on Q1, not surprising given the stress in the European banking sector with trading on Credit Suisse, Deustche Bank and other European banks in CDS markets much higher in CDS markets.
EUR iTraxx volumes representing 90% of EUR volume in the latest quarter.
EUR iTraxx

- iTraxx Europe 2023Q1 volume of €2.38 trillion, down from €2.66 trillion in 2022Q1
- iTraxx Crossover 2023Q1 volume of €470 billion, down from €566 billion in 2022Q1
- iTraxx MSCI ESG with just $25 million in the quarter
iTraxx Europe volumes in 2023Q1 representing 83.5% of EUR Index volumes.
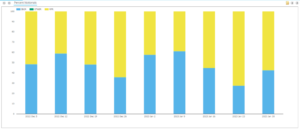
Market Share of EUR iTraxx

- ICE Clear Credit with 62.85% in 2023Q1, down from 67.4% in 2022Q1
- LCH CDSClear with 19.4% in 2023Q1, up from 11.2% in 2022Q1
- ICE Clear Europe with 17.7% in 2023Q1, down from 21.4% in 2022Q1
As recently reported, ICE will stop CDS clearing fom March 2023 in London based ICE Clear Europe and consolidate into Chicago based ICE Clear Credit, so this is the last quarter with share for ICE Clear Europe. One to watch in subsequent quarters to see if most of this share moves to LCH CDSClear, as appears to be the case from the above charts or most to ICE Clear Credit.
EUR CDS (single-name)

- CDS Single-name Corporate volume of €294 billion, up 128% from €129 billion in 2022Q1
- CDS Single-name CPFinancial volume of €8 billion, up from €4.8 billion in 2022Q1
Market Share of EUR CDS (single-name)

- ICE Clear Credit with 44.4% in 2023Q1,up from 37.4% in 2021Q3
- LCH CDS Clear with 28.05% in 2023Q1, down from 34% in 2021Q3
- ICE Clear Europe with 27.5% in 2023Q1, down from 28.6% in 2021Q3
ICE Clear Credit up from a year earlier, with both LCH CDSClear and ICE Clear Europe down, so different to iTraxx where LCH CDSClear share is up and the other two down.
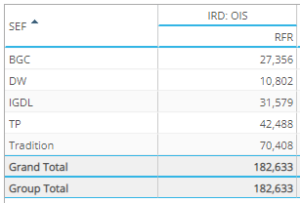
EUR iTraxxSwaptions volume of €8.5 billion in 2023Q1, is from LCH CDSClear with €8.44 billion and ICE Clear Credit with €25 million, while LCH CDSClear is down from €26.3 billion in 2022Q4.
JPY CDX and CDS
And for our final chart, JPY CDX and CDS volumes.

- JPY CDX volume in 2023Q1 was Y337 billion, up from Y167 billion in 2022Q1
- JPY CDS volume in 2023Q1 was Y142 billion, up from Y115 billion in 2022Q1
- Overall volumes in the quarter at Y479 billion, up from Y282 billion a year earlier
- While Q2 and Q4 have much higher volumes
All the volume is at JSCC.
That’s It
11 charts to cover CRD.
There is a lot more data in CCPView.
Daily, weekly, monthly, quarterly or annual.
Volume, ADV, Open Interest, OI Change.
More granular data at single-name level.
Please contact us if you are interested in a subscription.
- SEO Powered Content & PR Distribution. Get Amplified Today.
- Platoblockchain. Web3 Metaverse Intelligence. Knowledge Amplified. Access Here.
- Minting the Future w Adryenn Ashley. Access Here.
- Source: https://www.clarusft.com/1q23-ccp-volumes-and-share-in-crd/?utm_source=rss&utm_medium=rss&utm_campaign=1q23-ccp-volumes-and-share-in-crd
- :is
- $2.5 billion
- $3
- $UP
- 1
- 11
- 2%
- 2023
- 28
- 39
- 66
- 67
- 7
- 8
- 84
- a
- above
- and
- annual
- ARE
- AS
- asia
- At
- Australia
- Bank
- Banking
- banking sector
- Banks
- based
- BE
- Billion
- by
- case
- Category
- ccp
- CDS
- change
- Chart
- Charts
- chicago
- clear
- Clearing
- consolidate
- Corporate
- cover
- credit
- credit suisse
- data
- decrease
- Derivatives
- detail
- different
- down
- Earlier
- ESG
- Ether (ETH)
- EUR
- Europe
- European
- European banking
- final
- financials
- For
- Free
- from
- given
- Have
- higher
- houses
- HTTPS
- ICE
- in
- index
- Indices
- informed
- interest
- interested
- IT
- JPY
- Last
- latest
- Level
- London
- Lot
- March
- Market
- Markets
- massively
- million
- millions
- monthly
- more
- most
- moves
- MSCI
- names
- Newsletter
- of
- on
- ONE
- open
- open interest
- Other
- our
- plato
- Plato Data Intelligence
- PlatoData
- Product
- Q1
- Q2
- Quarter
- representing
- represents
- Reuters
- review
- sector
- Series
- Share
- similar
- single
- So
- sovereign
- Stop
- stress
- subscribe
- subscription
- subsequent
- Suisse
- surprising
- terms
- The
- to
- Total
- touch
- Trading
- Trillion
- USD
- volume
- volumes
- Watch
- weekly
- while
- will
- with
- year
- zephyrnet