- USD/JPY’s two weeks rally ex-post BoJ’s flexible YCC implementation has almost reached a key resistance zone of 145.50/146.10.
- Rising of concerns about another bout of verbal FX interventions from Ministry of Finance officials to talk down the USD/JPY at around the 145.00 psychological level.
- Short-term momentum has turned bearish, risk of downside mean reversion towards the 20-day moving average now acting as support at 141.85.
The ex-post effect of Bank of Japan (BoJ)’s flexible 10-year Japanese Government Bond (JGB) Yield Curve Control (YCC) announcement on the 28 July monetary policy meeting has led to a 716 pips rally (+5.2%) seen in the USD / JPY from its 28 July low of 138.55 to today, 14 August Asian session intraday high of 145.22.
Interestingly, the current intraday high of 145.22 coincided with a recent medium-term swing high of 145.07 printed on 30 June 2023 that witnessed drummed-up verbal FX intervention from Japan’s Ministry of Finance (MoF) officials to smooth out JPY weakness at the 145.00 psychology level of USD/JPY in the past.
No signs of verbal intervention so far from MoF officials, but current intraday price actions seen in today’s Asian session have suggested that such fears are rising in the marketplace, USD/JPY has attempted to push higher at the start of today’s Japan session with an intraday high print of 145.22 but bulls were not able to maintain their posture and drifted lower to 144.86, and record a current intraday loss of -0.08% at this time of the writing.
145.50/146.10 resistance is a key area of confluence
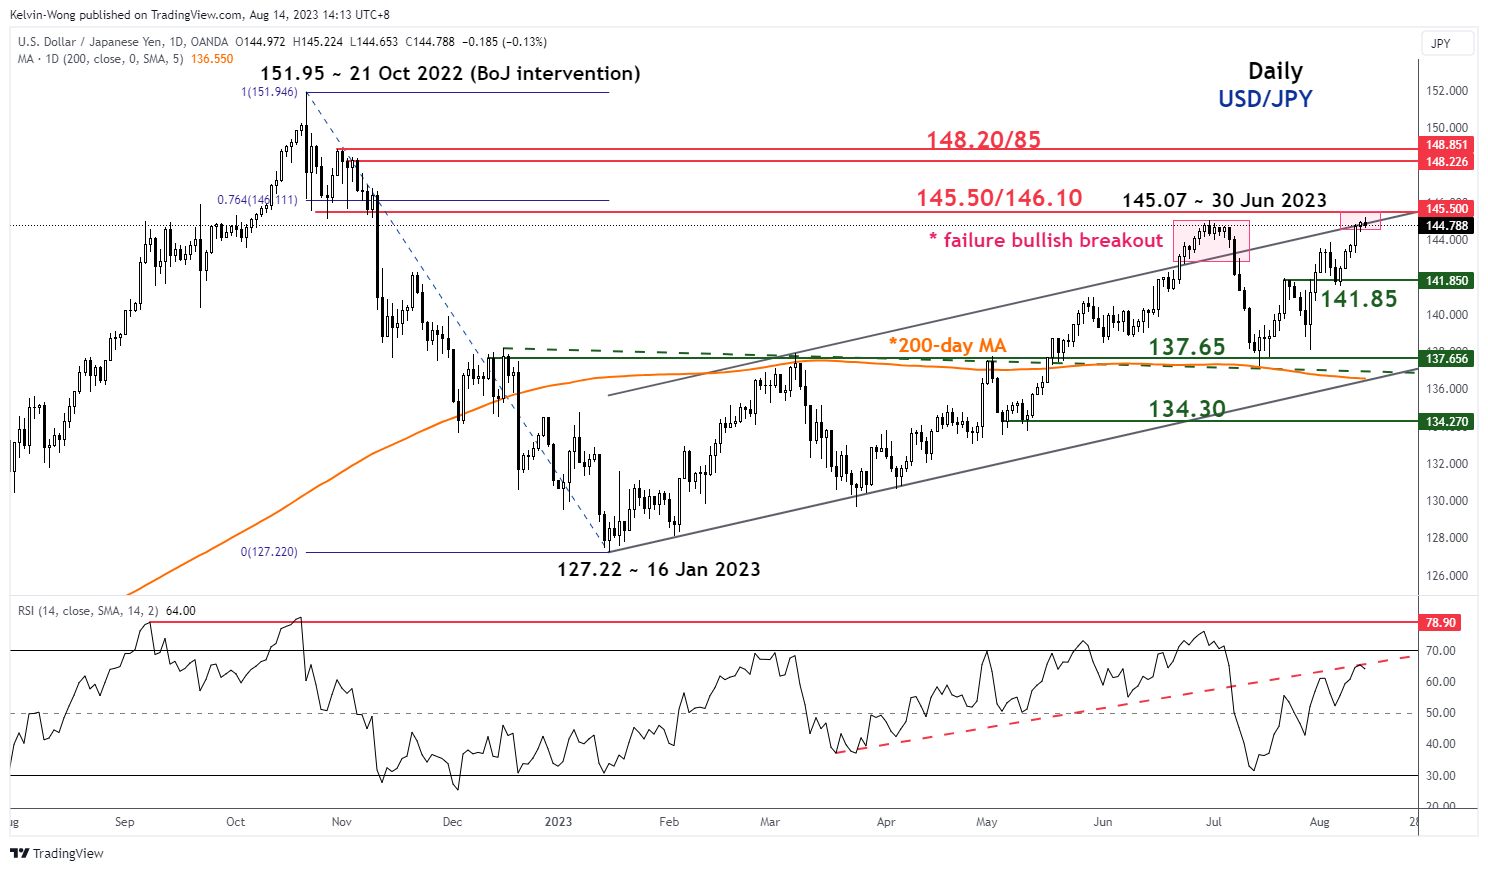
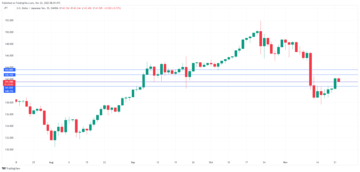
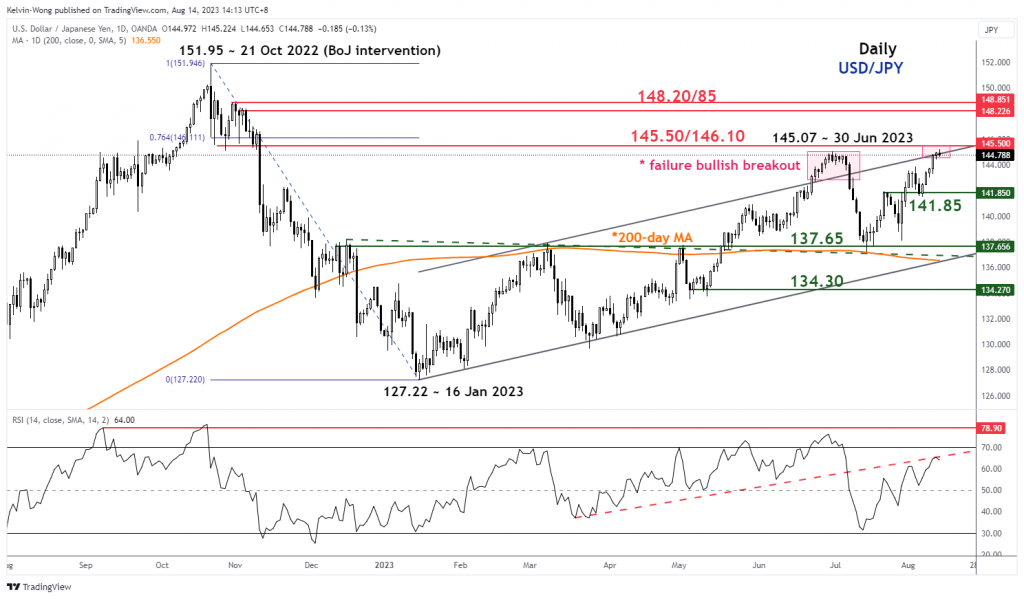
Afb. 1: USD/JPY-trend op middellange termijn vanaf 14 augustus 2023 (Bron: TradingView, klik om grafiek te vergroten)
Today’s Asian session push-up in price actions has led the USD/JPY to retest the upper boundary of the medium-term ascending channel in place since the 16 January 2023 low of 127.22, the former swing low areas of 24 October/2 November 2022, and the 76.4% Fibonacci retracement of the prior medium-term downtrend phase from 21 October 2022 high to 16 January 2023 low which confluences at the 145.50/141.10 resistance zone.
Het kortetermijnmomentum is bearish geworden
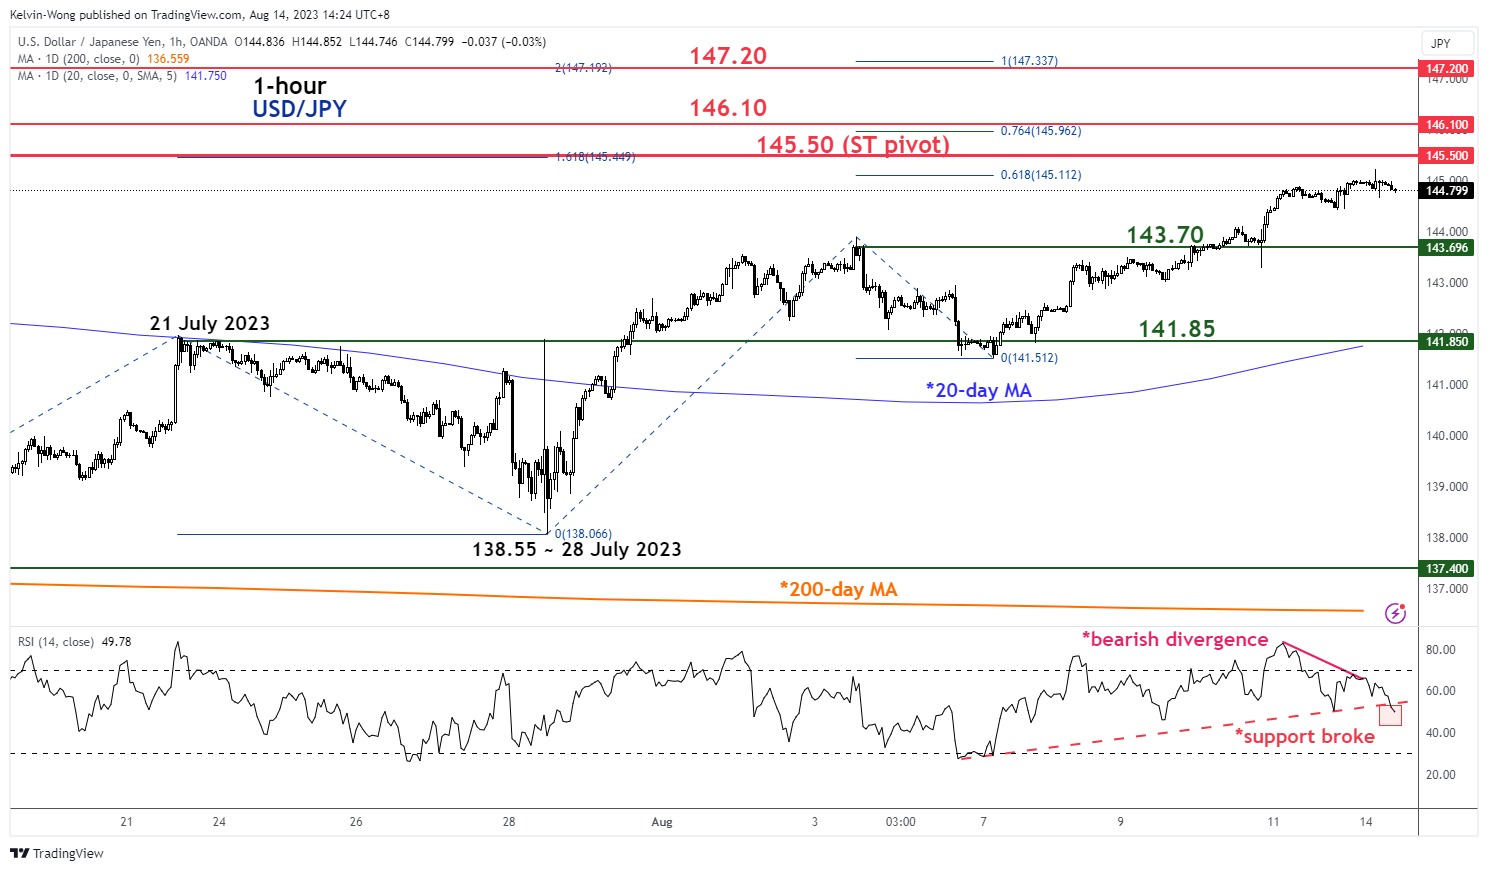
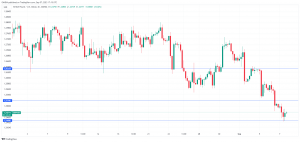
Fig 2: USD/JPY kleine kortetermijntrend vanaf 14 augustus 2023 (Bron: TradingView, klik om grafiek te vergroten)
The hourly RSI oscillator has started to stage a breakdown below its parallel ascending support at the 54 level after a prior bearish divergence condition was flashed out last Friday, 11 August.
Watch the 145.50 key short-term pivotal resistance and a break below the intermediate support of 143.70 exposes the next support at 141.85 (also the 20-day moving average).
On the other hand, a clearance above 145.50 sees 146.10 next, and a break above it may propel it higher toward the next resistance at 147.20 (Fibonacci extension cluster).
Inhoud is alleen voor algemene informatiedoeleinden. Het is geen beleggingsadvies of een oplossing om effecten te kopen of te verkopen. Meningen zijn de auteurs; niet noodzakelijkerwijs die van OANDA Business Information & Services, Inc. of een van haar gelieerde ondernemingen, dochterondernemingen, functionarissen of directeuren. Als u de inhoud van MarketPulse, een bekroonde forex-, grondstoffen- en wereldwijde indices-analyse- en nieuwssite-service geproduceerd door OANDA Business Information & Services, Inc., wilt reproduceren of herdistribueren, ga dan naar de RSS-feed of neem contact met ons op via info@marketpulse.com. Bezoeken https://www.marketpulse.com/ om meer te weten te komen over het ritme van de wereldmarkten. © 2023 OANDA Business Information & Services Inc.
Laatste berichten door Kelvin Wong (bekijk alle)
- Door SEO aangedreven content en PR-distributie. Word vandaag nog versterkt.
- PlatoData.Network Verticale generatieve AI. Versterk jezelf. Toegang hier.
- PlatoAiStream. Web3-intelligentie. Kennis versterkt. Toegang hier.
- PlatoESG. Automotive / EV's, carbon, CleanTech, Energie, Milieu, Zonne, Afvalbeheer. Toegang hier.
- Plato Gezondheid. Intelligentie op het gebied van biotech en klinische proeven. Toegang hier.
- ChartPrime. Verhoog uw handelsspel met ChartPrime. Toegang hier.
- BlockOffsets. Eigendom voor milieucompensatie moderniseren. Toegang hier.
- Bron: https://www.marketpulse.com/forex/usd-jpy-technical-lethargic-bulls-below-145-50/kwong
- : heeft
- :is
- :niet
- 07
- 1
- 10
- 11
- 14
- 15 jaar
- 15%
- 16
- 2%
- 20
- 2022
- 2023
- 22
- 24
- 28
- 30
- 50
- 70
- 700
- a
- in staat
- Over
- boven
- toegang
- waarnemend
- acties
- toevoeging
- advies
- filialen
- Na
- ook
- an
- analyse
- en
- Aankondiging
- Nog een
- elke
- ZIJN
- GEBIED
- gebieden
- rond
- AS
- Aziatisch
- At
- gepoogd
- Aug
- Augustus
- auteur
- auteurs
- Avatar
- gemiddelde
- onderscheiding
- Bank
- Bank of Japan
- bearish
- bearish divergentie
- onder
- boei
- band
- Box camera's
- Breken
- Storing
- Bulls
- bedrijfsdeskundigen
- maar
- knoppen
- kopen
- by
- Kanaal
- tabel
- Klik
- TROS
- viel samen
- COM
- combinatie van
- Commodities
- Zorgen
- voorwaarde
- uitgevoerd
- Wij verbinden
- contact
- content
- onder controle te houden
- cursussen
- Actueel
- curve
- Raad van bestuur
- Afwijking
- beneden
- keerzijde
- effect
- Elliott
- vergroten
- Ether (ETH)
- uitwisseling
- ervaring
- expert
- uitbreiding
- ver
- angsten
- Fibonacci
- financiën
- financieel
- VIND DE PLEK DIE PERFECT VOOR JOU IS
- flexibel
- stroom
- Voor
- vreemd
- deviezen
- forex
- Voormalig
- gevonden
- vrijdag
- oppompen van
- fonds
- fundamenteel
- FX
- Algemeen
- Globaal
- wereldwijde markten
- Overheid
- hand
- Hebben
- Hoge
- hoger
- HTTPS
- if
- uitvoering
- in
- Inc
- Index
- informatie
- Gemiddeld
- tussenkomst
- interventies
- investering
- IT
- HAAR
- Januari
- Japan
- Japan's
- Japanse
- JGB
- Japanse Yen
- juli-
- juni
- Kelvin
- sleutel
- belangrijke weerstand
- Achternaam*
- LED
- Niveau
- niveaus
- als
- uit
- Laag
- te verlagen
- Macro
- onderhouden
- Markt
- marktvooruitzichten
- marktonderzoek
- markt
- MarketPulse
- Markten
- max-width
- Mei..
- gemiddelde
- Gemiddelde omkering
- vergadering
- ministerie
- minder
- stuwkracht
- monetair
- Monetair beleid
- meer
- bewegend
- voortschrijdend gemiddelde
- nodig
- nieuws
- volgende
- November
- nu
- vele
- oktober
- of
- officieren
- ambtenaren
- on
- Slechts
- Meningen
- or
- Overige
- uit
- Outlook
- over
- Parallel
- hartstochtelijk
- verleden
- perspectieven
- fase
- foto
- centraal
- plaats
- Plato
- Plato gegevensintelligentie
- PlatoData
- dan
- beleidsmaatregelen
- positionering
- Berichten
- prijs
- Voorafgaand
- geproduceerd
- Voortbewegen
- het verstrekken van
- Psychologie
- doeleinden
- Duwen
- verzameling
- bereikt
- recent
- record
- onderzoek
- Weerstand
- <HR>Retail
- retracement
- Omkering
- stijgende
- Risico
- rsi
- rss
- Effecten
- gezien
- ziet
- verkopen
- senior
- service
- Diensten
- Sessie
- delen
- korte termijn
- Signs
- sinds
- Singapore
- website
- glad
- So
- dusver
- oplossing
- bron
- gespecialiseerd
- Stadium
- begin
- gestart
- voorraad
- Aandelen markt
- Strateeg
- dergelijk
- ondersteuning
- Schommel
- Talk
- Technisch
- Technische Analyse
- tien
- dat
- De
- hun
- dit
- duizenden kosten
- niet de tijd of
- naar
- vandaag
- vandaag
- in de richting van
- in de richting van
- Traders
- Handel
- TradingView
- Trainingen
- trend
- Gedraaid
- twee
- unieke
- us
- USD / JPY
- gebruik
- v1
- Bezoek
- was
- Wave
- zwakte
- weken
- GOED
- waren
- welke
- het winnen van
- Met
- getuige
- wong
- zou
- het schrijven van
- jaar
- Opbrengst
- opbrengstcurve
- opbrengstcurvecontrole
- u
- zephyrnet